
- Home >
- Stock Photos >
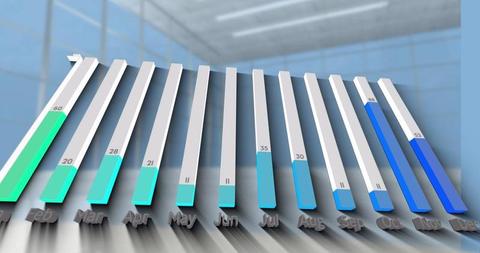
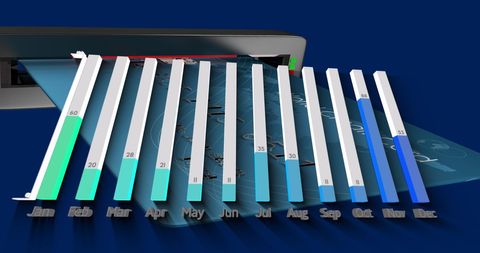
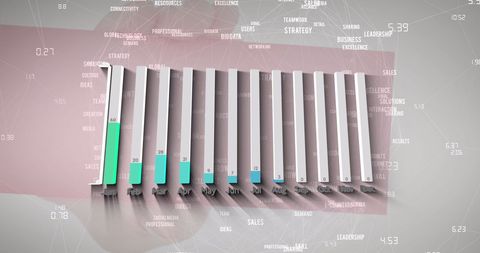
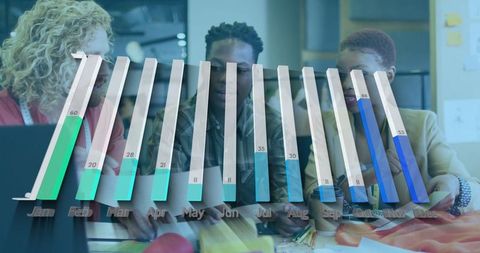
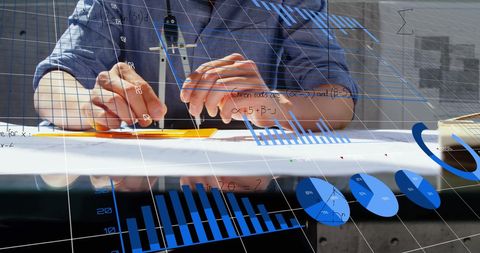
- Diverse Students Using Computers with Financial Graph Overlay
Diverse Students Using Computers with Financial Graph Overlay Image

Image depicts diverse students engaging with computers in classroom while colorful financial graphs overlay scene. Themes of education, technology integration, financial literacy. Useful for articles, presentations on modern edu-tech approaches, diversity in education, related training materials.
Powered by 


downloads
Tags:
More
Credit Photo
If you would like to credit the Photo, here are some ways you can do so
Text Link
photo Link
<span class="text-link">
<span>
<a target="_blank" href=https://pikwizard.com/photo/diverse-students-using-computers-with-financial-graph-overlay/140c28e1fd1d50a6f816fb90679cb329/>PikWizard</a>
</span>
</span>
<span class="image-link">
<span
style="margin: 0 0 20px 0; display: inline-block; vertical-align: middle; width: 100%;"
>
<a
target="_blank"
href="https://pikwizard.com/photo/diverse-students-using-computers-with-financial-graph-overlay/140c28e1fd1d50a6f816fb90679cb329/"
style="text-decoration: none; font-size: 10px; margin: 0;"
>
<img src="https://pikwizard.com/pw/medium/140c28e1fd1d50a6f816fb90679cb329.jpg" style="margin: 0; width: 100%;" alt="" />
<p style="font-size: 12px; margin: 0;">PikWizard</p>
</a>
</span>
</span>
Free (free of charge)
Free for personal and commercial use.
Author: People Creations
Similar Free Stock Images

Premium


Premium

Premium


Premium


Premium


Premium


Premium


Premium

Premium

Premium


Premium

Premium


Premium

Premium

Premium


Premium


Premium


Premium


Premium


Premium

Premium


Premium


Premium


Premium


Premium


Explore More Free Stock Images