- Home >
- Stock Photos >
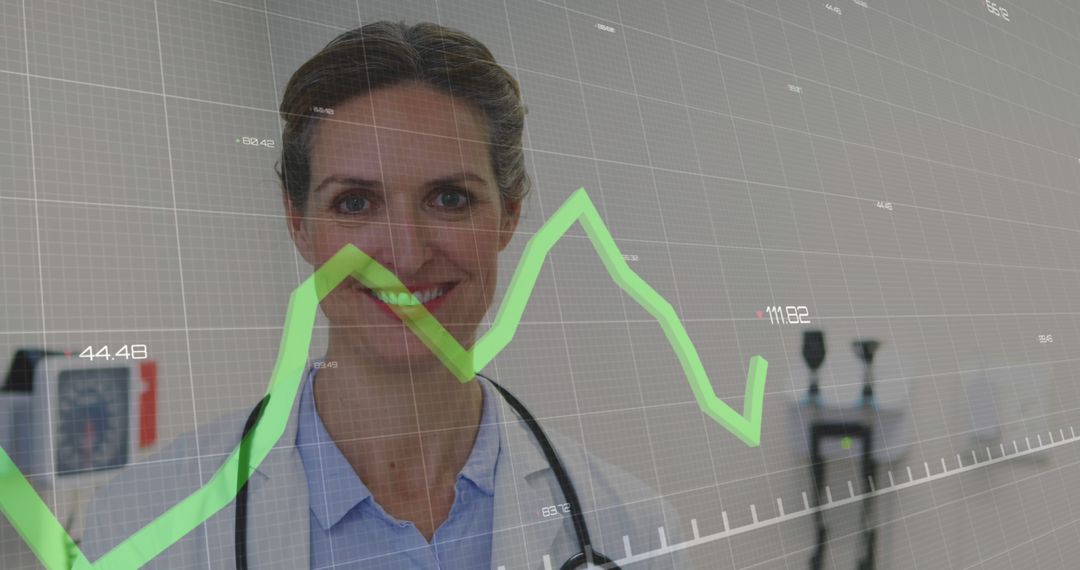
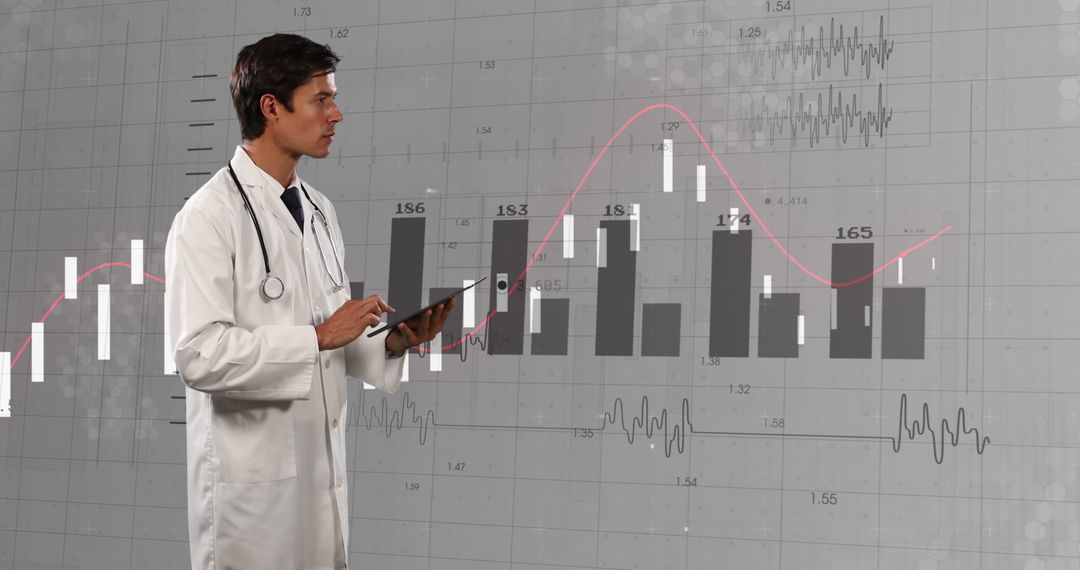
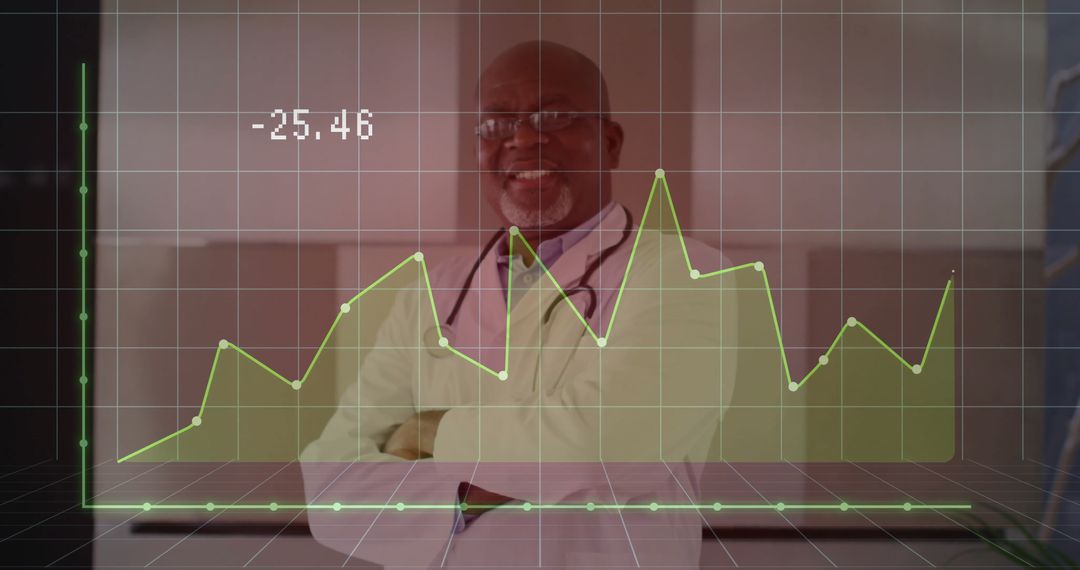
- Doctor Analyzing Data Trends with Chart Graph Overlay in Medical Setting
Doctor Analyzing Data Trends with Chart Graph Overlay in Medical Setting Image

The image portrays a doctor in a clinical environment analyzing medical data illustrated by an overlaid grid chart with red lines. This picture is suitable for articles, presentations, or websites focusing on the integration of technology and healthcare, data trends in medical diagnostics, or the role of analytics in improving healthcare outcomes.
Powered by 


0
downloads
downloads
Tags:
More
Credit Photo
If you would like to credit the Photo, here are some ways you can do so
Text Link
photo Link
<span class="text-link">
<span>
<a target="_blank" href=https://pikwizard.com/photo/doctor-analyzing-data-trends-with-chart-graph-overlay-in-medical-setting/faa5b0093701ffc30798758a41cd6905/>PikWizard</a>
</span>
</span>
<span class="image-link">
<span
style="margin: 0 0 20px 0; display: inline-block; vertical-align: middle; width: 100%;"
>
<a
target="_blank"
href="https://pikwizard.com/photo/doctor-analyzing-data-trends-with-chart-graph-overlay-in-medical-setting/faa5b0093701ffc30798758a41cd6905/"
style="text-decoration: none; font-size: 10px; margin: 0;"
>
<img src="https://pikwizard.com/pw/medium/faa5b0093701ffc30798758a41cd6905.jpg" style="margin: 0; width: 100%;" alt="" />
<p style="font-size: 12px; margin: 0;">PikWizard</p>
</a>
</span>
</span>
Free (free of charge)
Free for personal and commercial use.
Author: People Creations
Similar Free Stock Images

Premium


Premium


Premium


Premium


Premium


Premium


Premium


Premium


Premium


Premium


Premium


Premium


Premium


Premium


Premium


Premium


Premium


Premium


Premium


Premium


Premium


Premium


Premium


Premium