- Home >
- Stock Photos >
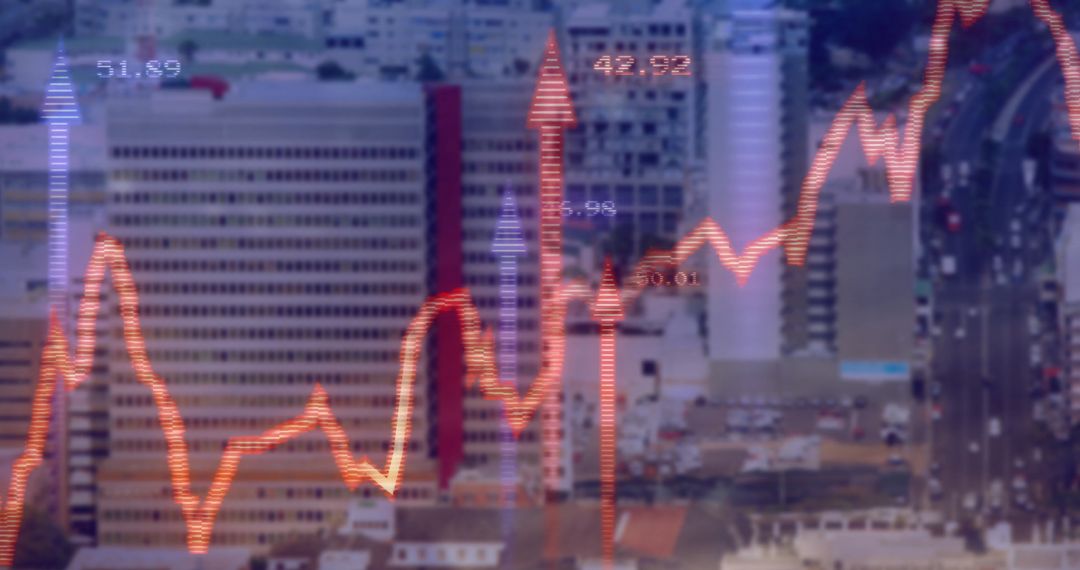
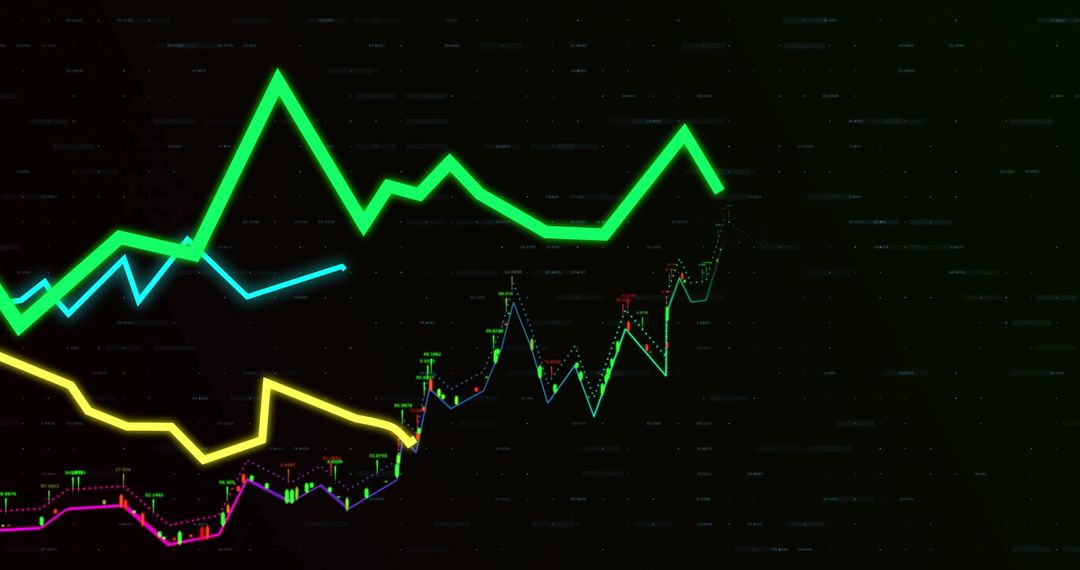
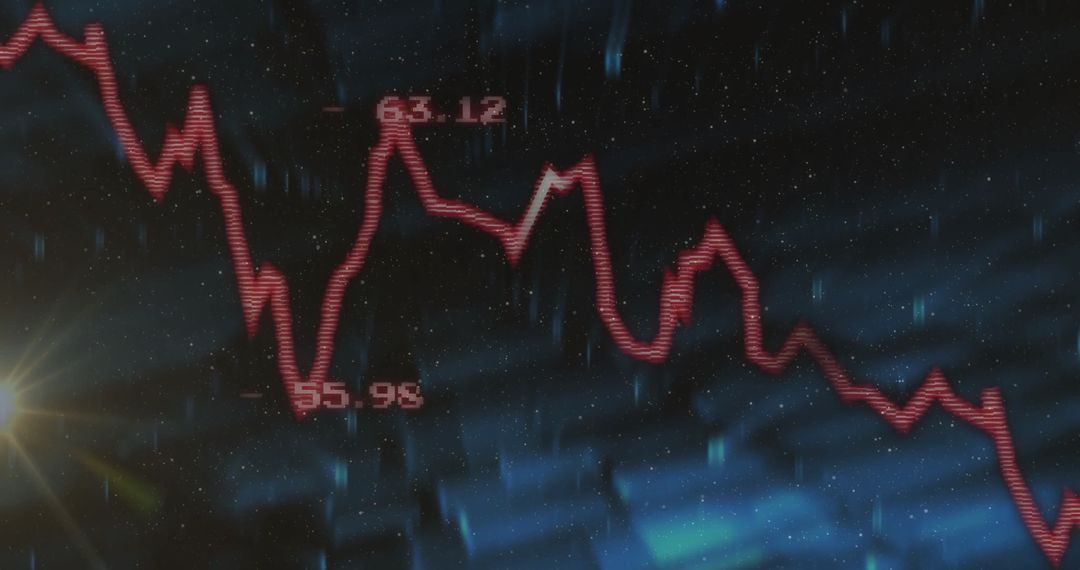
- Dollar Overlaid with Red Fluctuating Line Graph on Financial Dashboard
Dollar Overlaid with Red Fluctuating Line Graph on Financial Dashboard Image
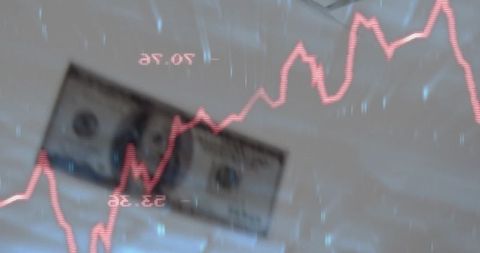
US dollar bill superimposed with red fluctuating line graph represents financial dynamics and economic trends. Effective for illustrating concepts of market analysis, business intelligence, and digital finance dashboards. Ideal for blogs, articles, or presentations on financial analytics and stock market insights.
Powered by  - Get 15% off with code: PIKWIZARD15


2
downloads
downloads
Tags:
More
Credit Photo
If you would like to credit the Photo, here are some ways you can do so
Text Link
photo Link
<span class="text-link">
<span>
<a target="_blank" href=https://pikwizard.com/photo/dollar-overlaid-with-red-fluctuating-line-graph-on-financial-dashboard/b8926a1afab70d96eb723c9f75539baa/>PikWizard</a>
</span>
</span>
<span class="image-link">
<span
style="margin: 0 0 20px 0; display: inline-block; vertical-align: middle; width: 100%;"
>
<a
target="_blank"
href="https://pikwizard.com/photo/dollar-overlaid-with-red-fluctuating-line-graph-on-financial-dashboard/b8926a1afab70d96eb723c9f75539baa/"
style="text-decoration: none; font-size: 10px; margin: 0;"
>
<img src="https://pikwizard.com/pw/medium/b8926a1afab70d96eb723c9f75539baa.jpg" style="margin: 0; width: 100%;" alt="" />
<p style="font-size: 12px; margin: 0;">PikWizard</p>
</a>
</span>
</span>
Free (free of charge)
Free for personal and commercial use.
Author: Authentic Images
Similar Free Stock Images

Premium


Premium


Premium


Premium


Premium


Premium


Premium


Premium


Premium


Premium


Premium


Premium


Premium


Premium


Premium


Premium


Premium


Premium


Premium


Premium


Premium


Premium


Premium


Premium