- Home >
- Stock Photos >
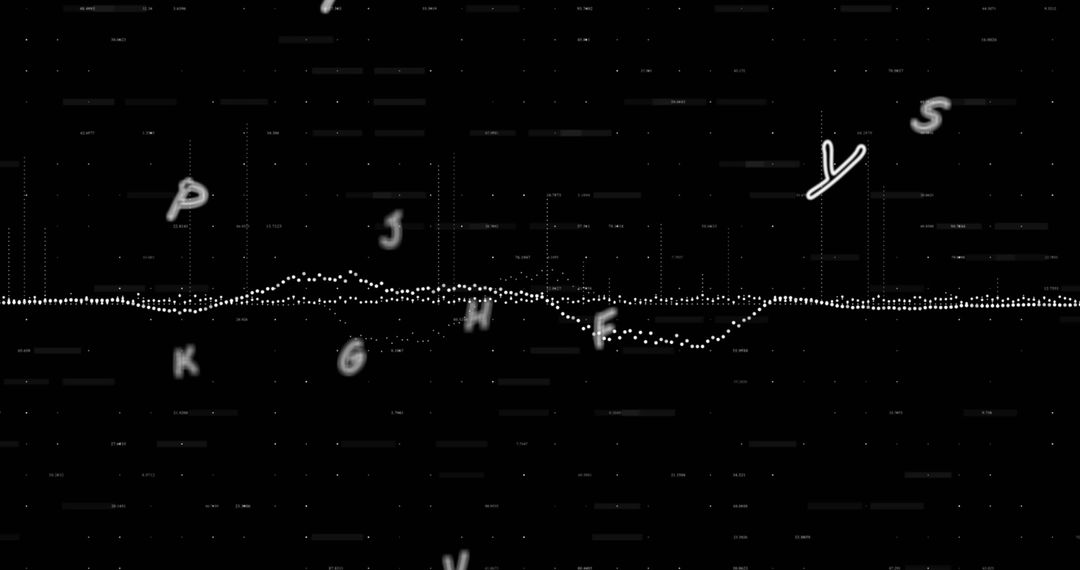
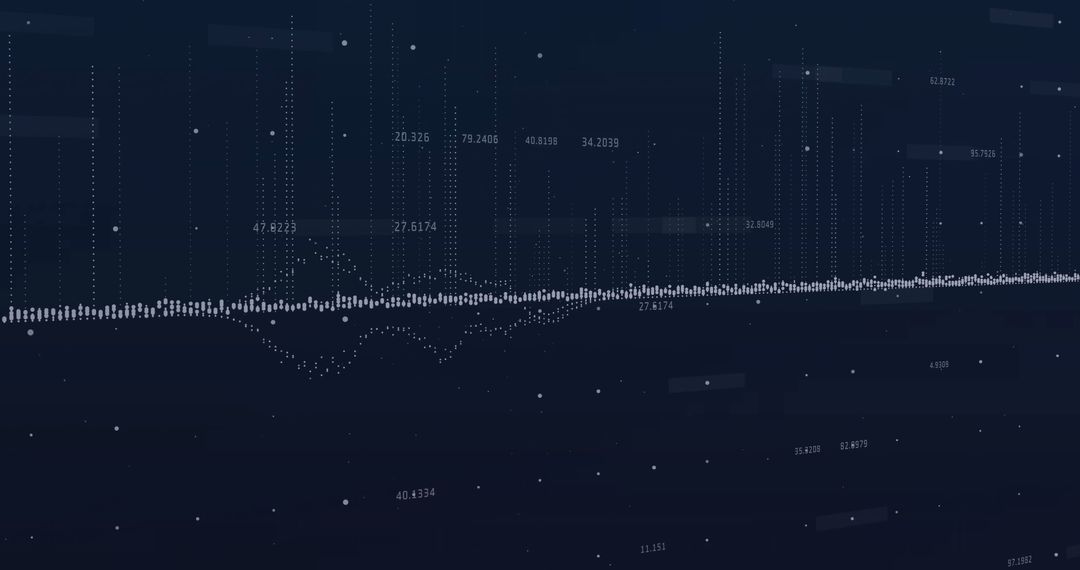
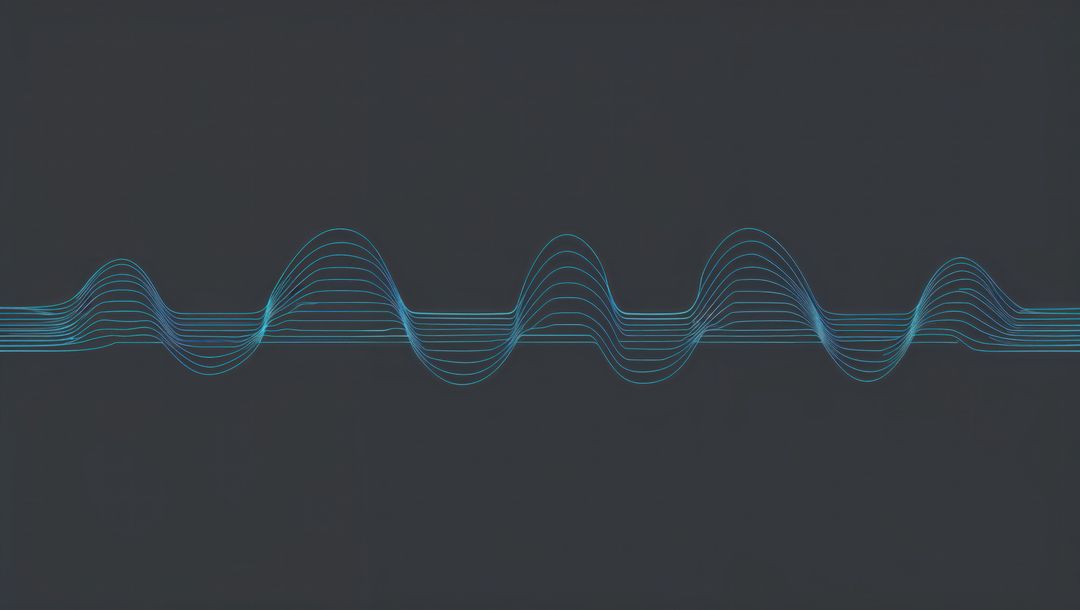
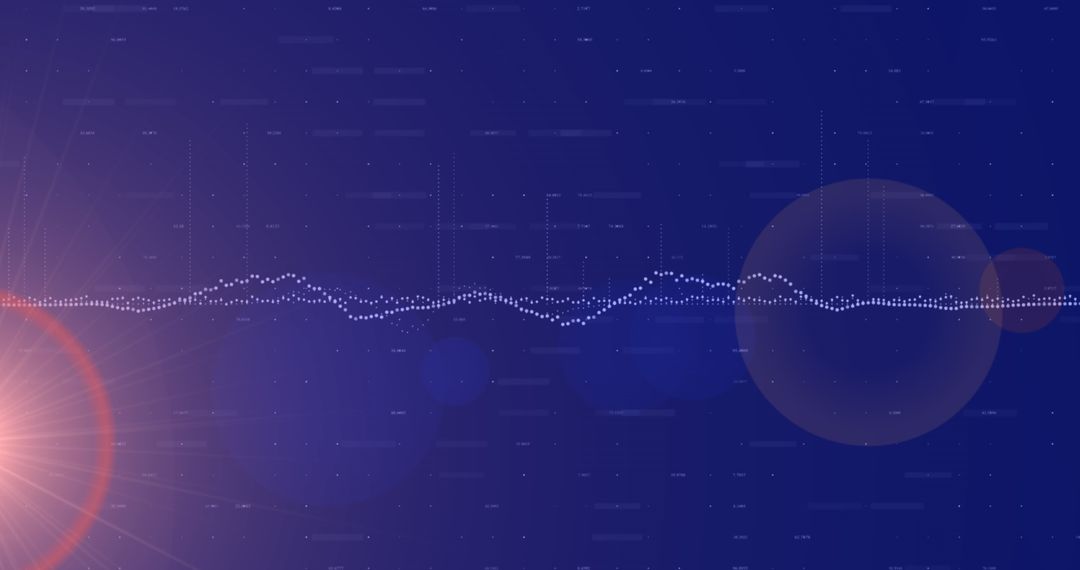
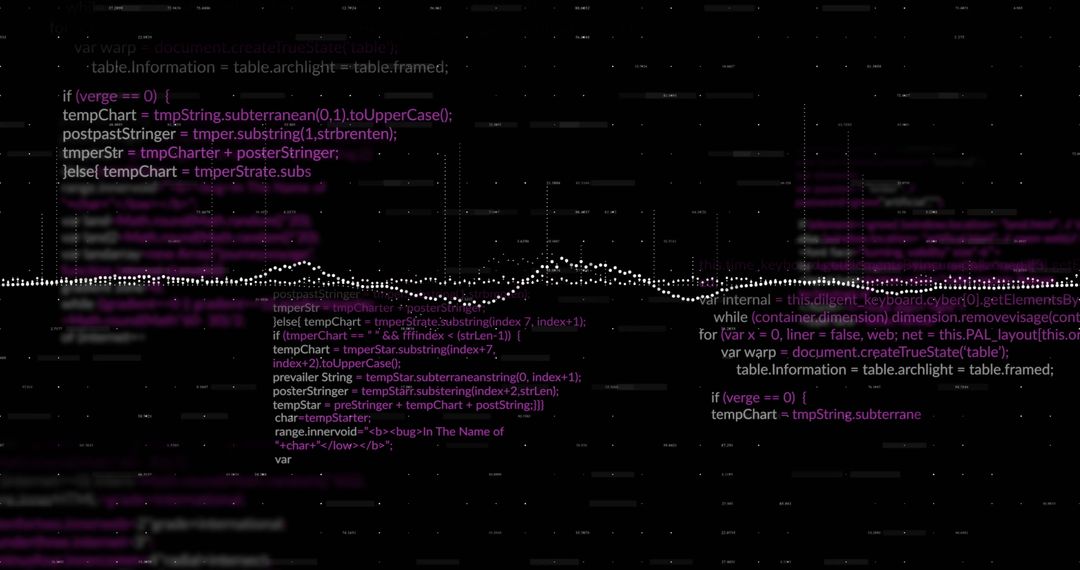
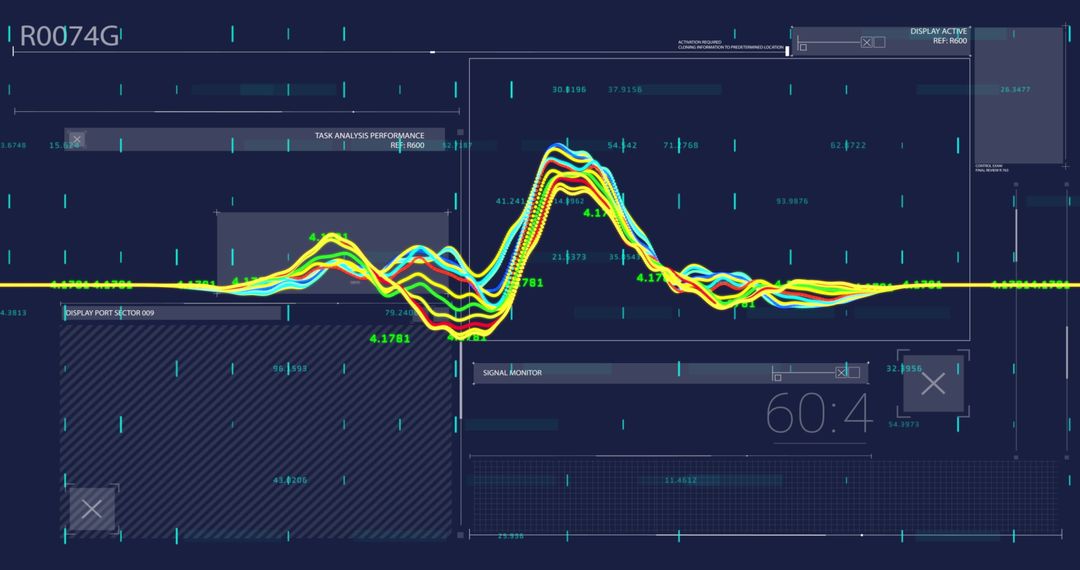
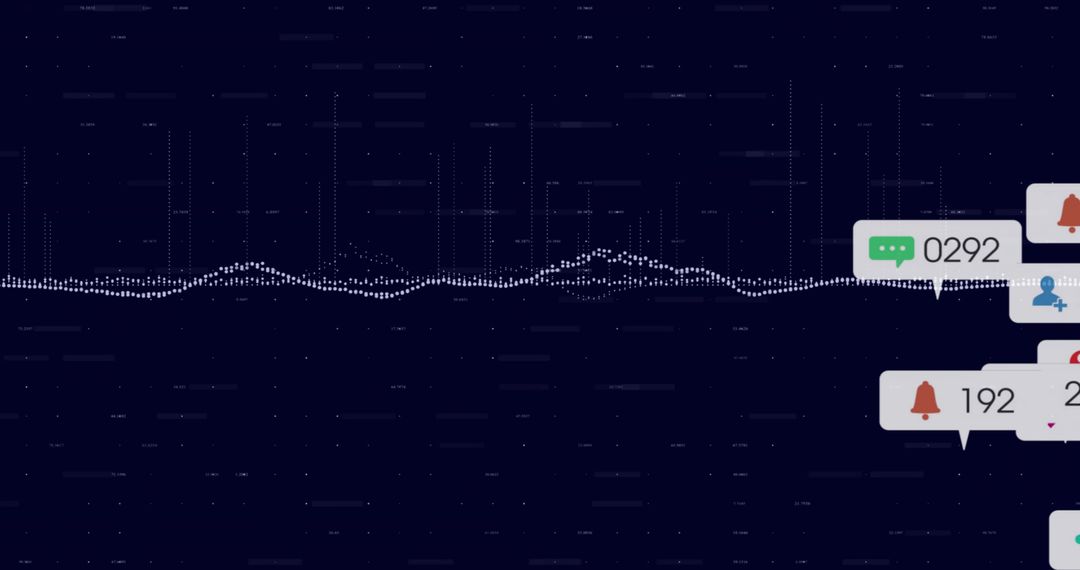
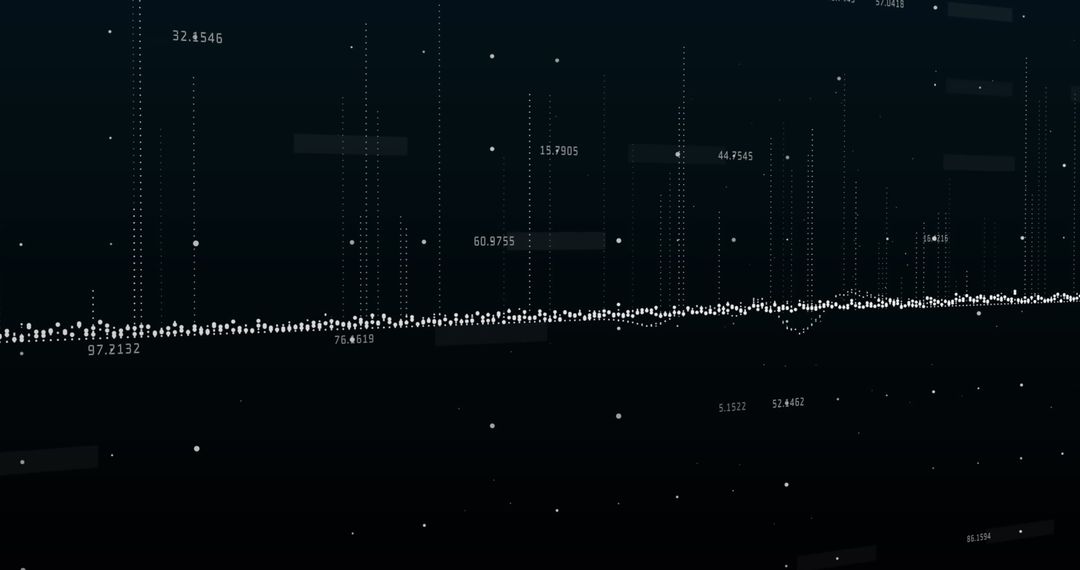
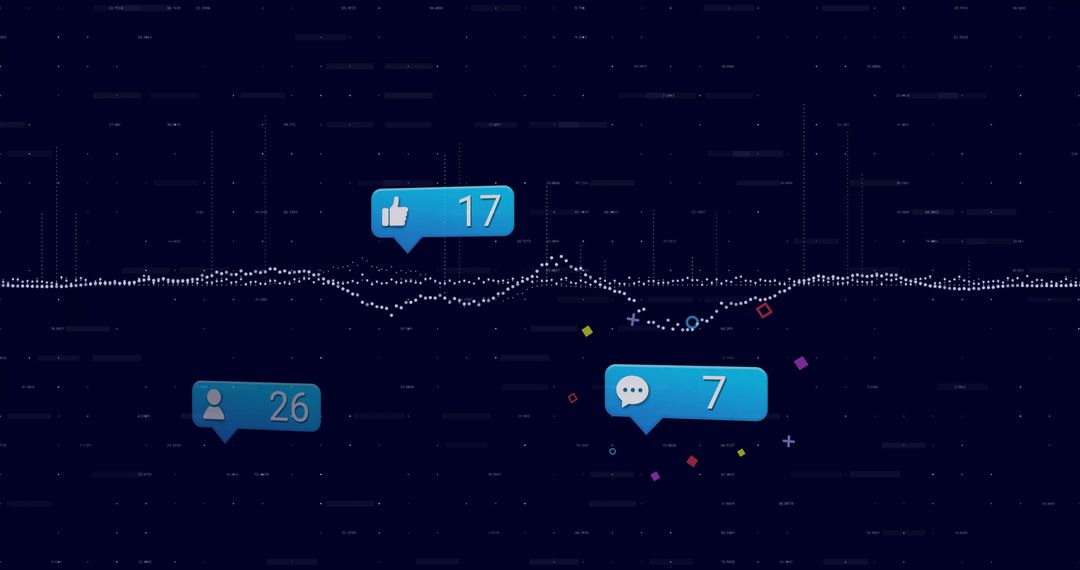
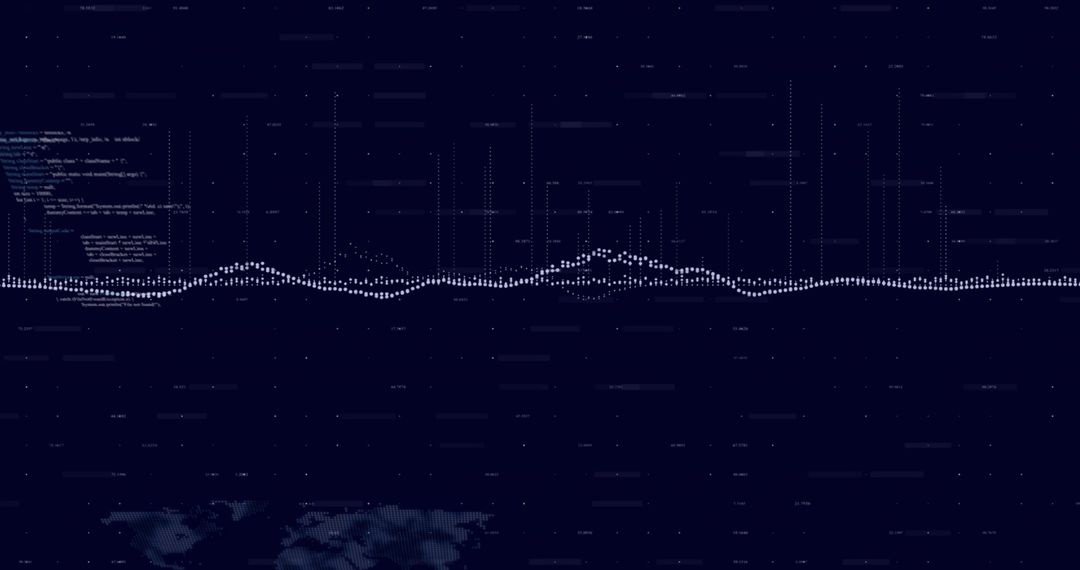
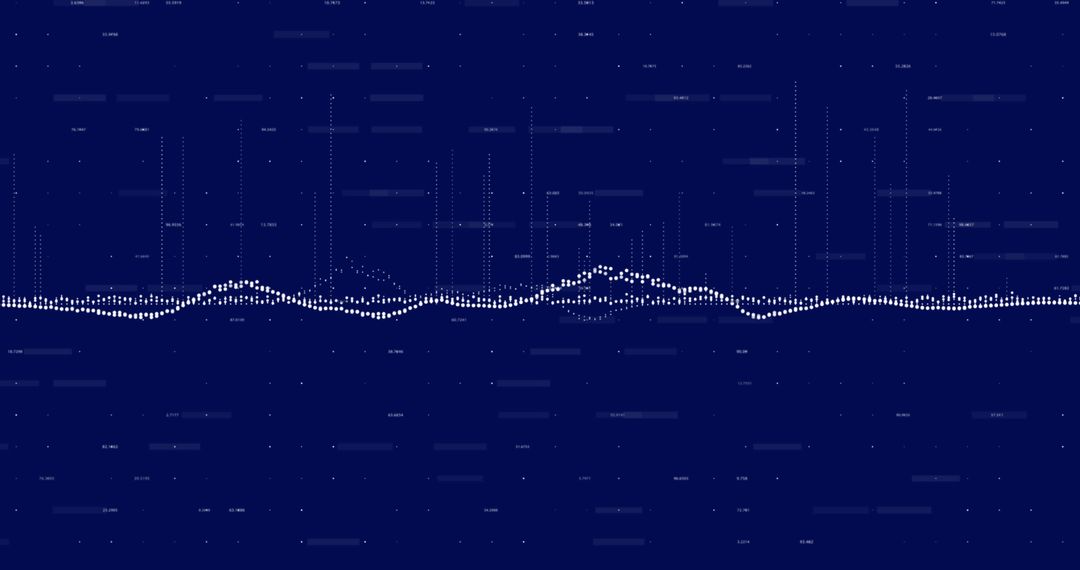
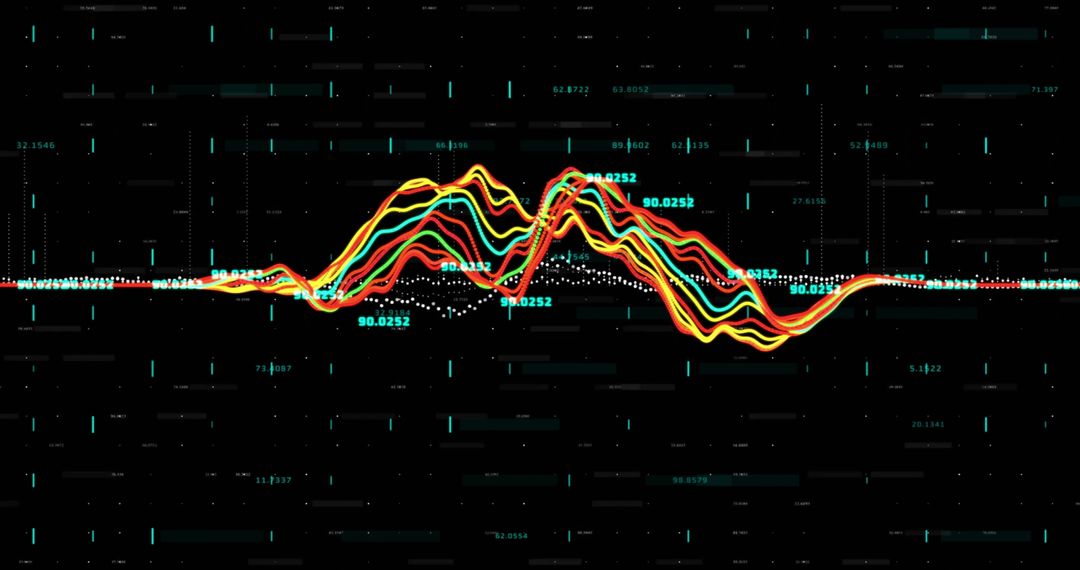
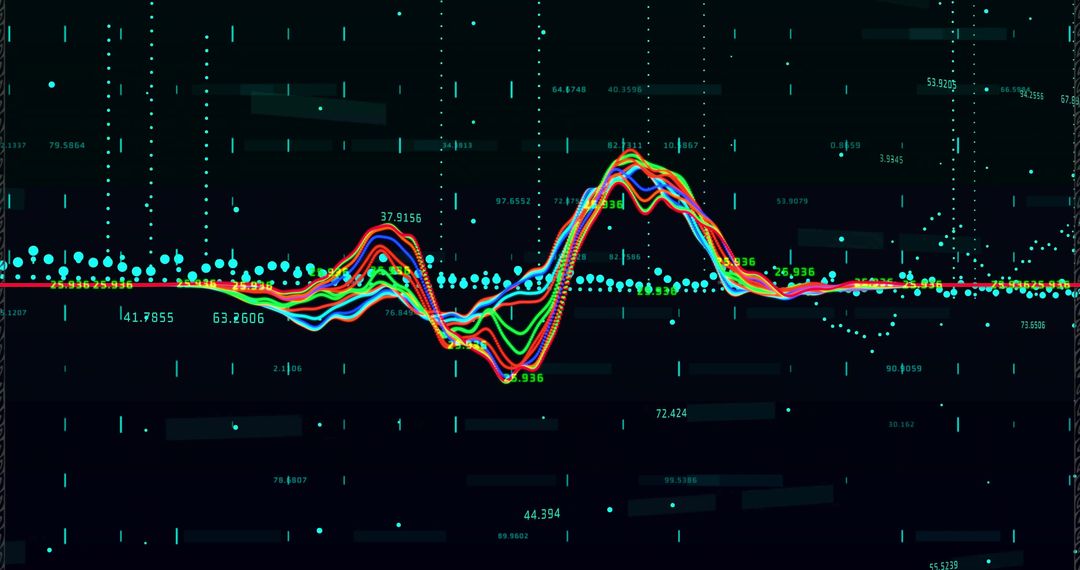
- Dotted Data Waveform Visualizing Real-Time Signal Pulse Across Dark Blue Grid
Dotted Data Waveform Visualizing Real-Time Signal Pulse Across Dark Blue Grid Image
Showing dotted waveform running horizontally across deep navy grid with subtle vertical data bars and tiny numeric markers. Featuring minimalist neon dots, smooth line peaks, and scattered particle noise for sleek high-tech aesthetic. Suiting technology presentations, data analytics dashboards, website hero headers, app UI mockups, broadcast graphics, and marketing materials for tech brands. Pairing with bold sans-serif typography and light accent colors for strong contrast. Providing wide high-resolution layout for responsive web projects, video intros, slide decks, and print collateral.
Powered by  - Get 15% off with code: PIKWIZARD15


0
downloads
downloads
Tags:
More
Credit Photo
If you would like to credit the Photo, here are some ways you can do so
Text Link
photo Link
<span class="text-link">
<span>
<a target="_blank" href=https://pikwizard.com/photo/dotted-data-waveform-visualizing-real-time-signal-pulse-across-dark-blue-grid/ff6484db4c95f5027c7c21431878c89f/>PikWizard</a>
</span>
</span>
<span class="image-link">
<span
style="margin: 0 0 20px 0; display: inline-block; vertical-align: middle; width: 100%;"
>
<a
target="_blank"
href="https://pikwizard.com/photo/dotted-data-waveform-visualizing-real-time-signal-pulse-across-dark-blue-grid/ff6484db4c95f5027c7c21431878c89f/"
style="text-decoration: none; font-size: 10px; margin: 0;"
>
<img src="https://pikwizard.com/pw/medium/ff6484db4c95f5027c7c21431878c89f.jpg" style="margin: 0; width: 100%;" alt="" />
<p style="font-size: 12px; margin: 0;">PikWizard</p>
</a>
</span>
</span>
Free (free of charge)
Free for personal and commercial use.
Author: Creative Art
Similar Free Stock Images

Premium


Premium


Premium


Premium


Premium


Premium


Premium


Premium

Premium


Premium


Premium


Premium


Premium


Premium


Premium


Premium


Premium

Premium


Premium

Premium


Premium


Premium


Premium


Premium