- Home >
- Stock Photos >
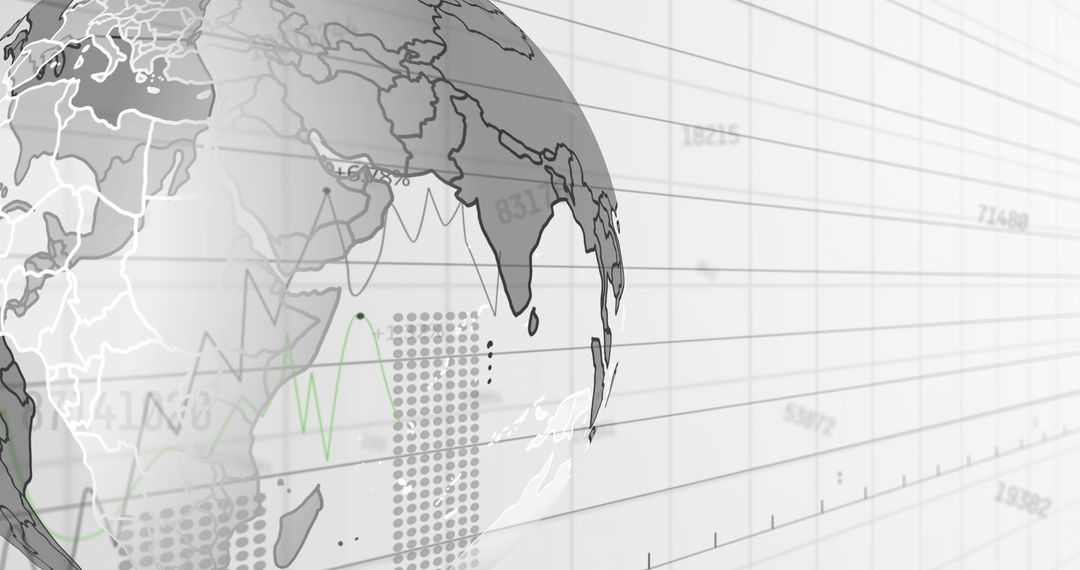
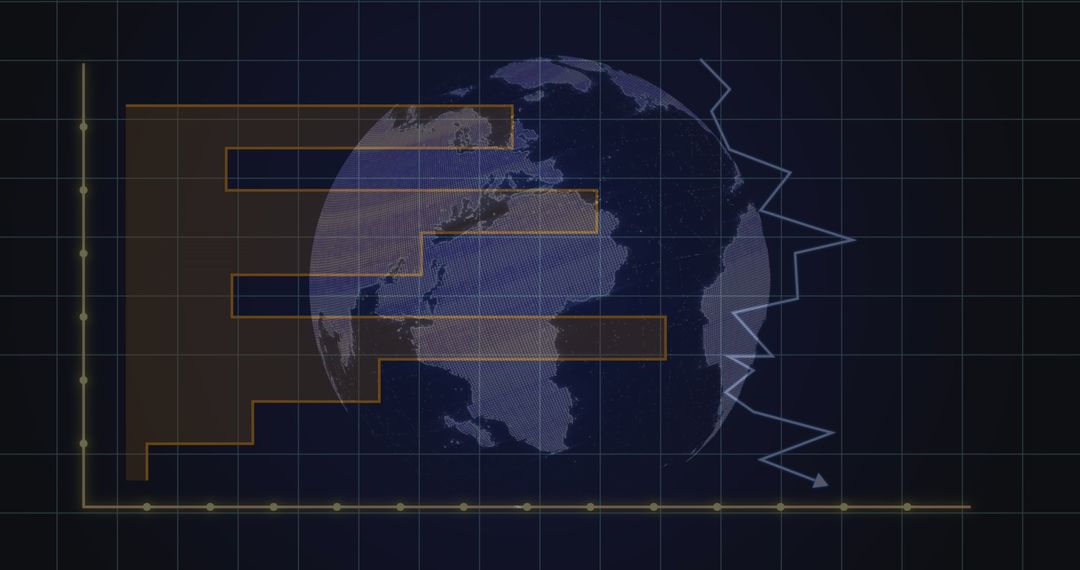
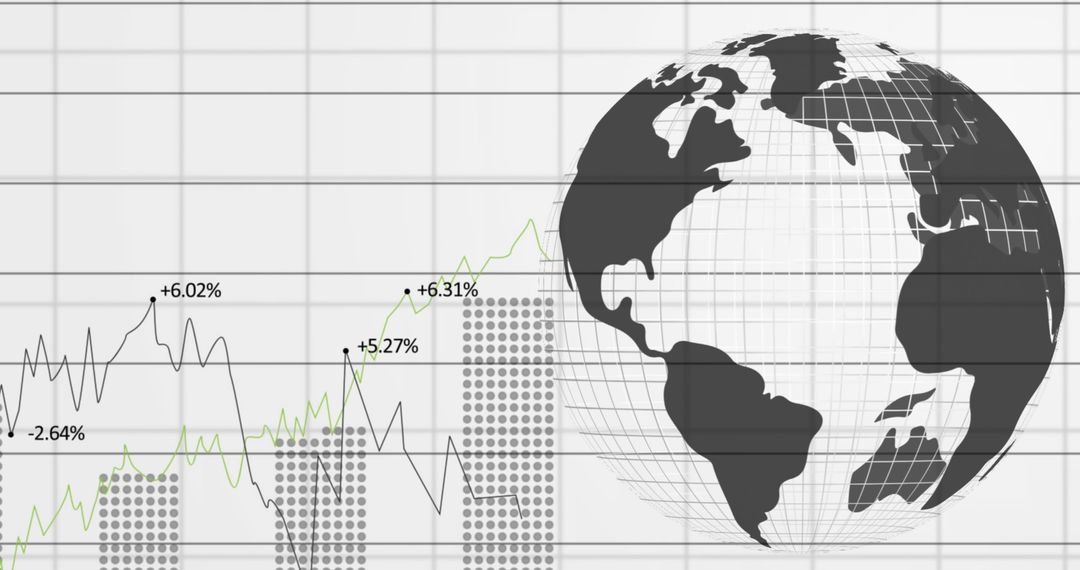
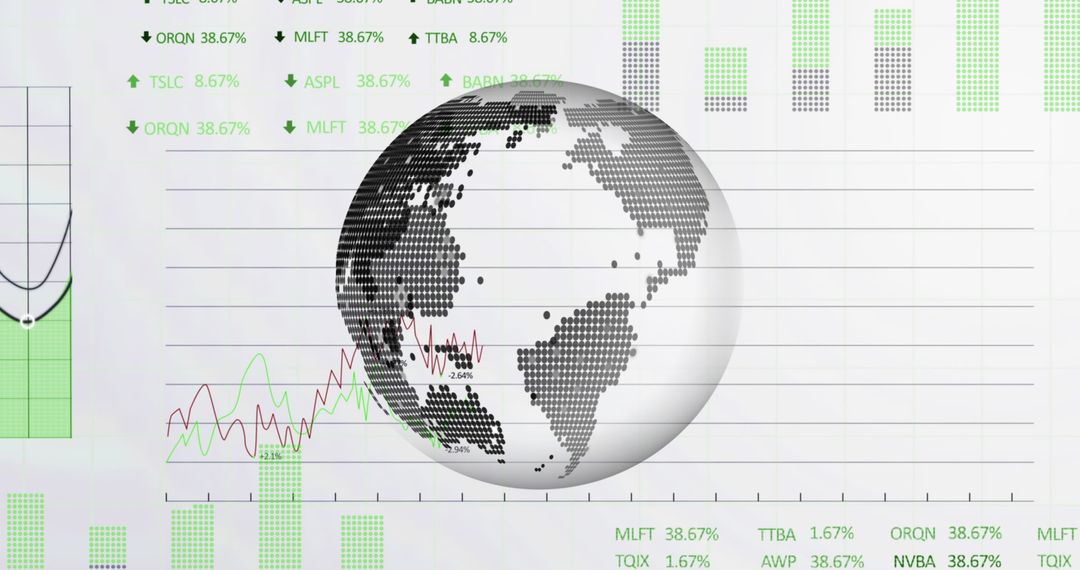
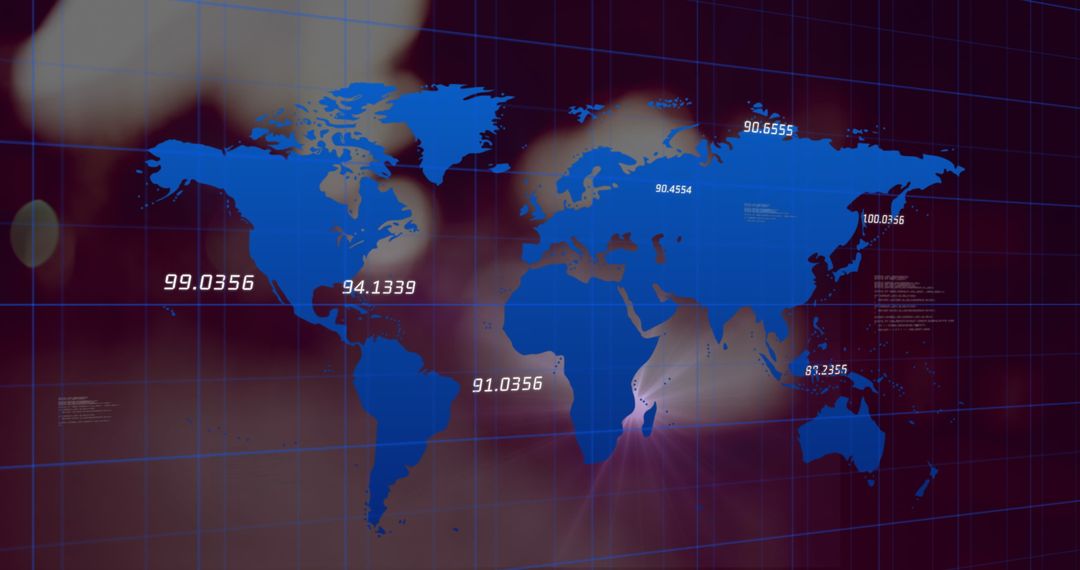
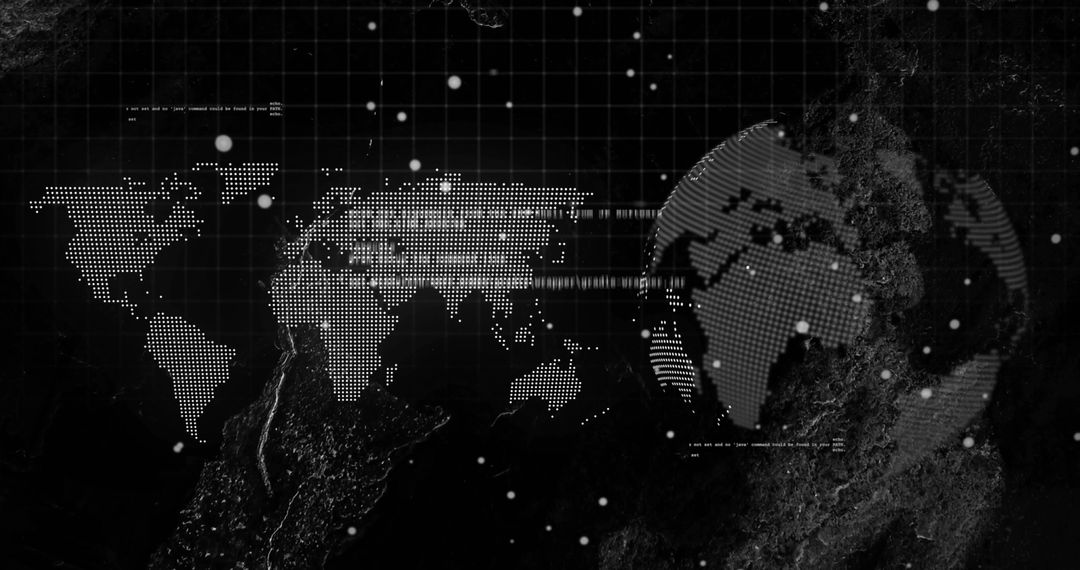
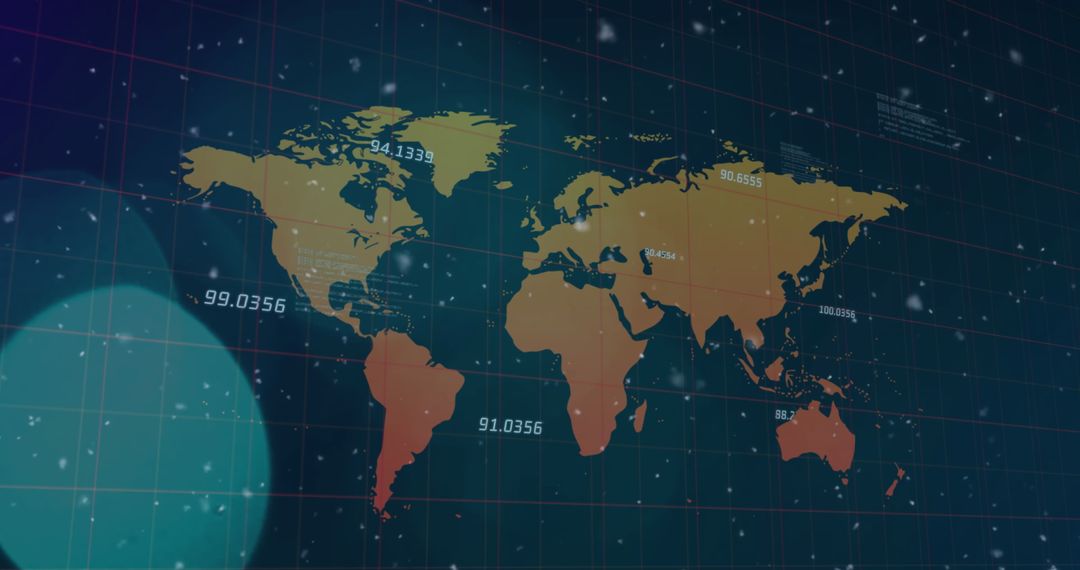
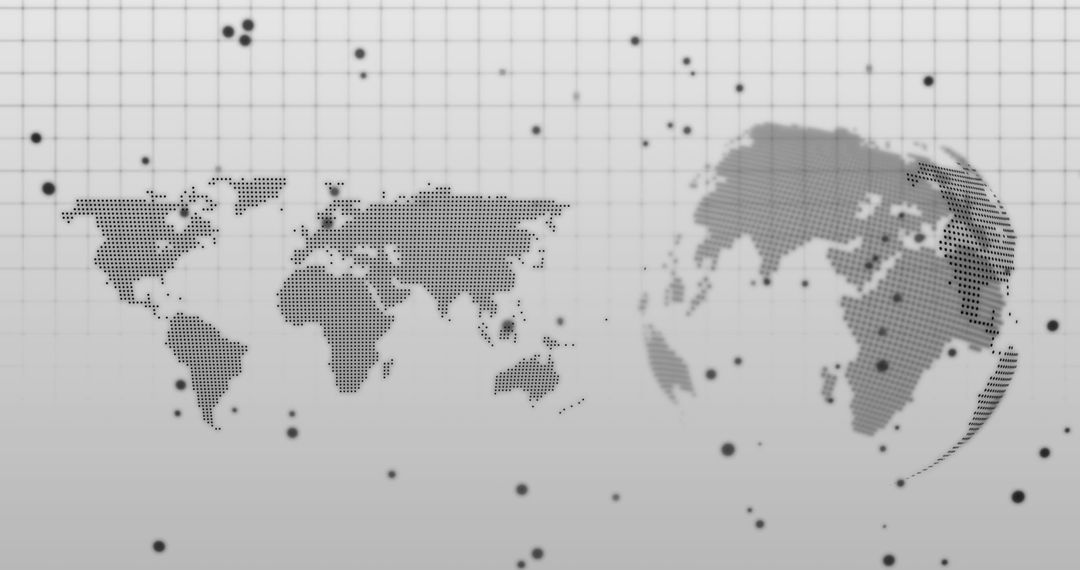
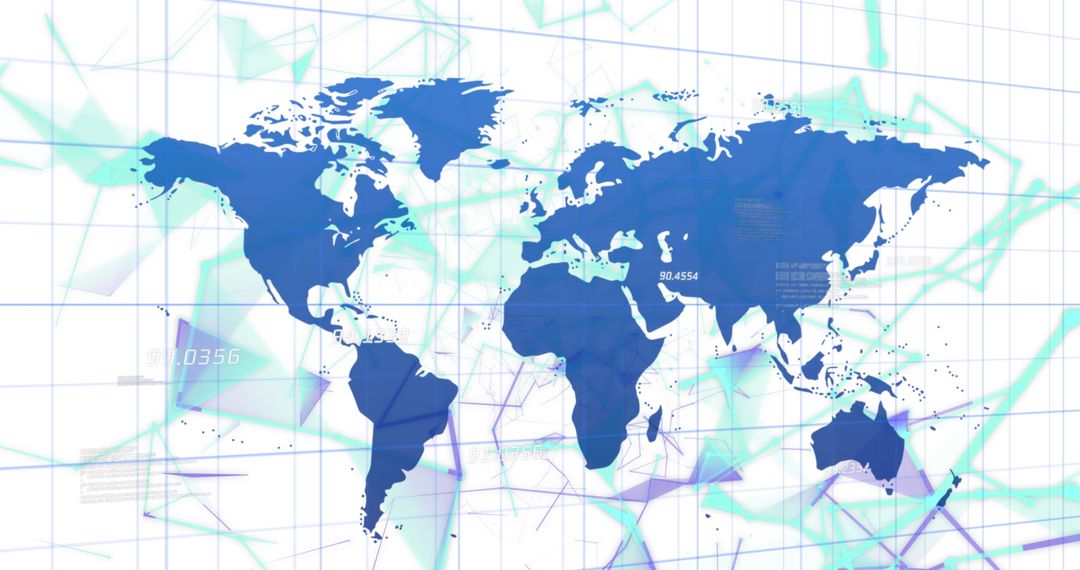
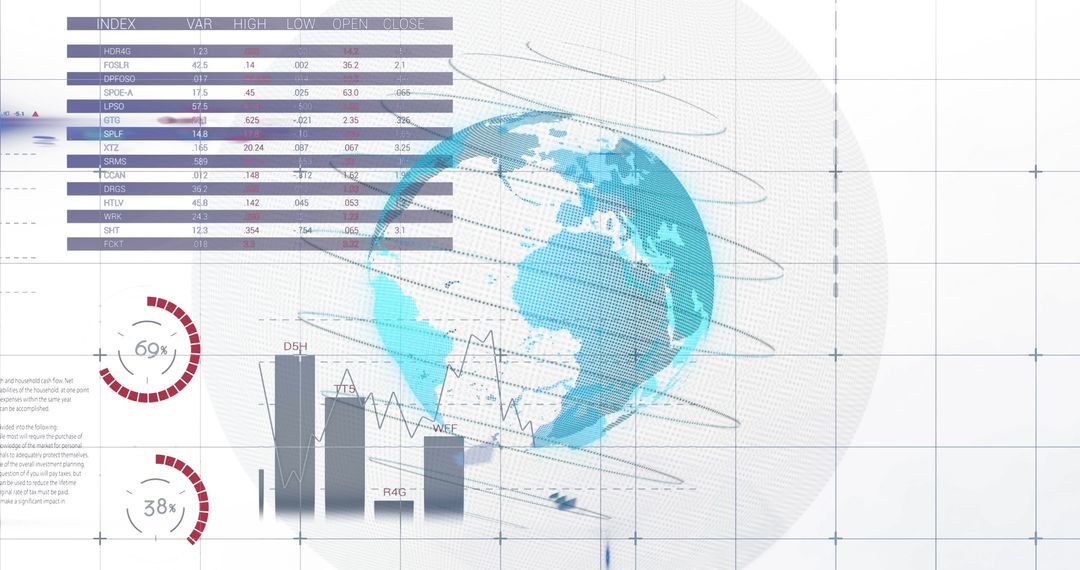
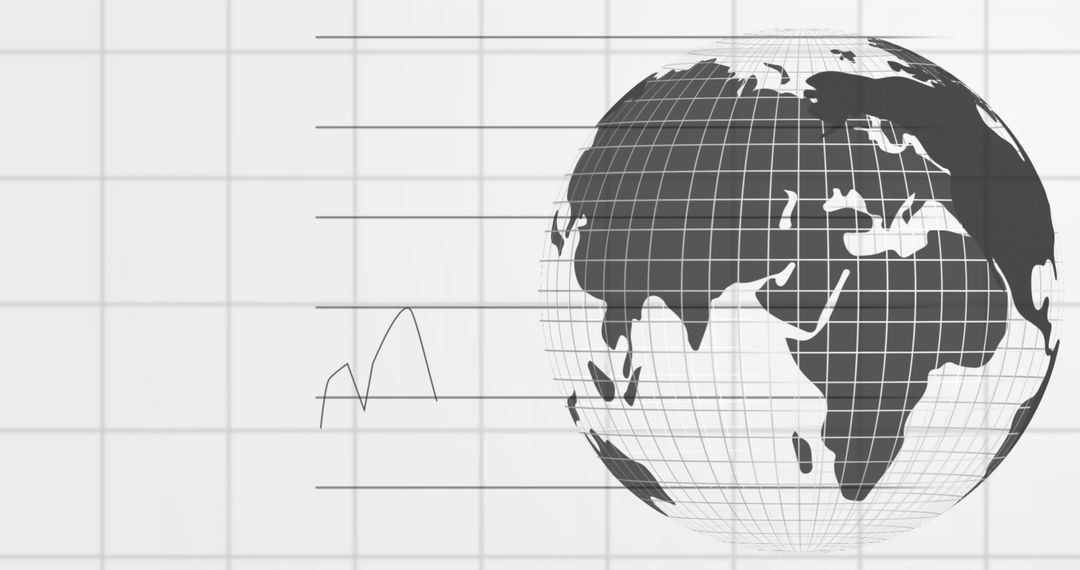
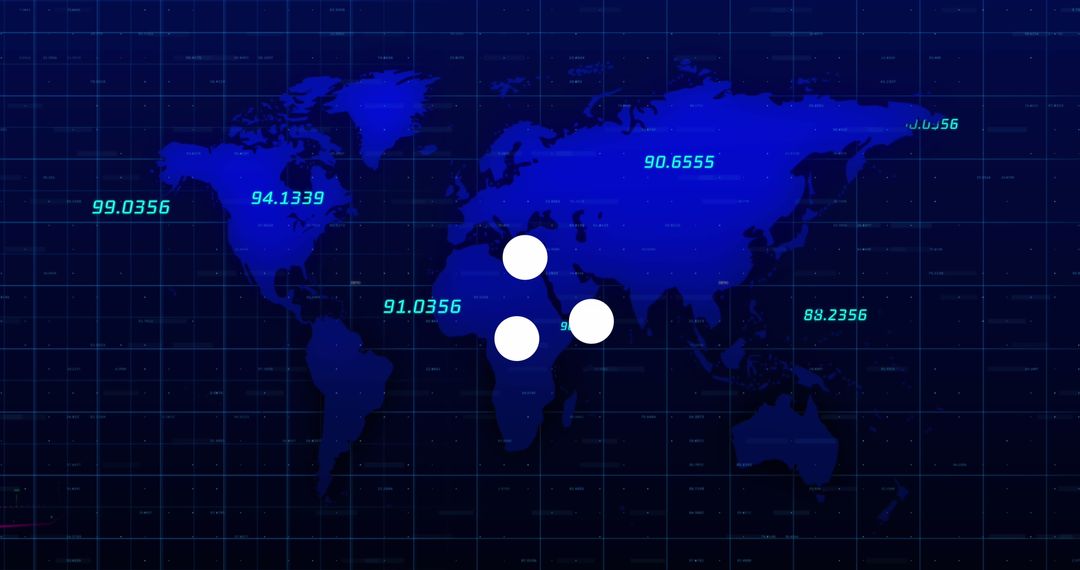
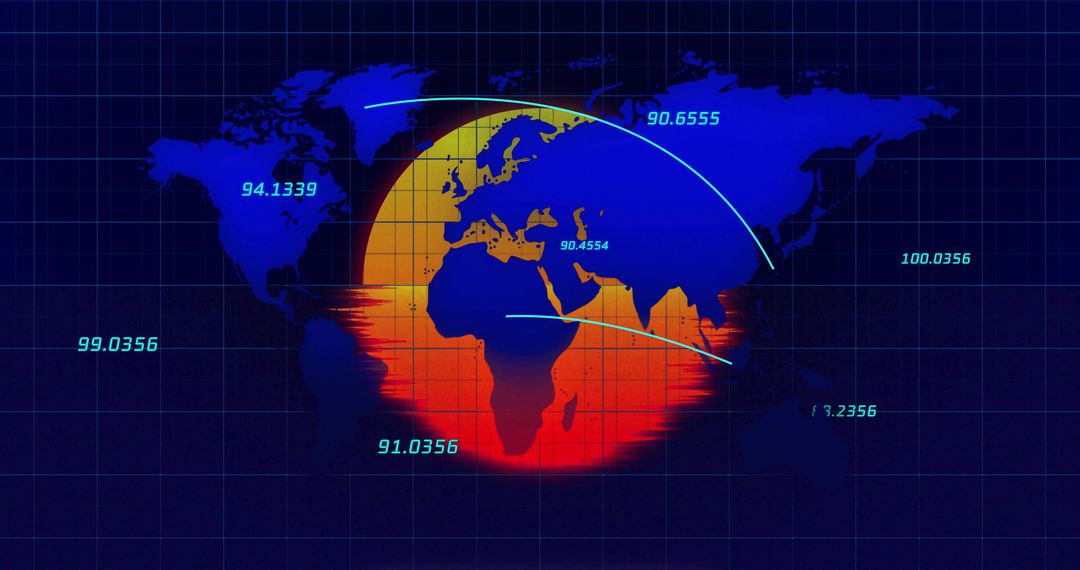
- Dotted World Map and Globe Overlaying Abstract Global Data Visualization with Blue Charts
Dotted World Map and Globe Overlaying Abstract Global Data Visualization with Blue Charts Image

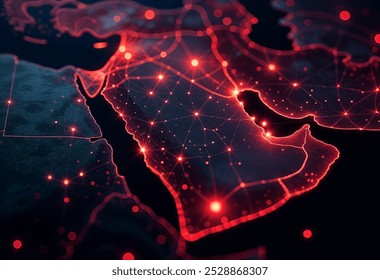
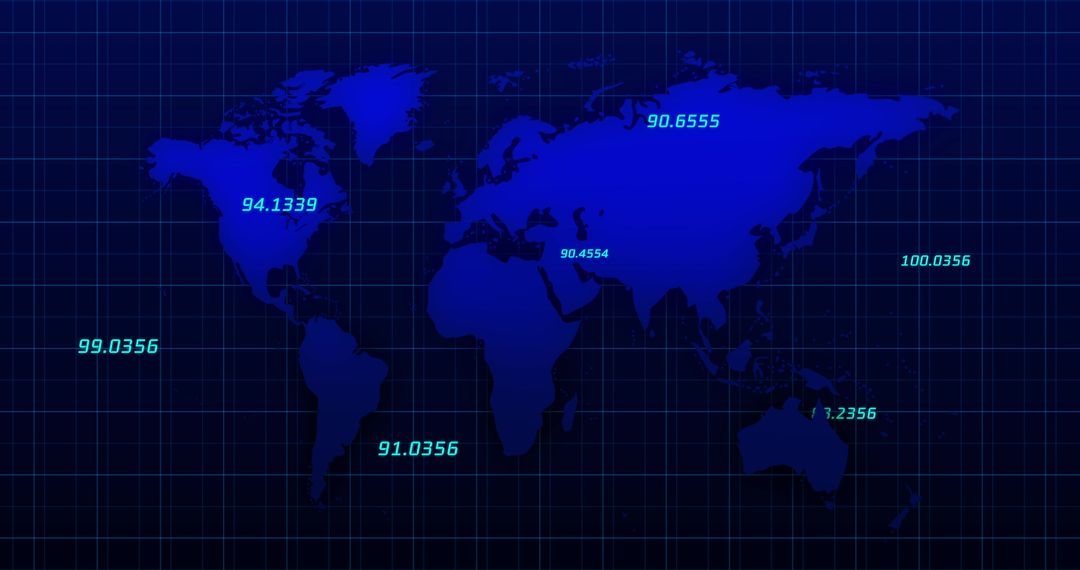
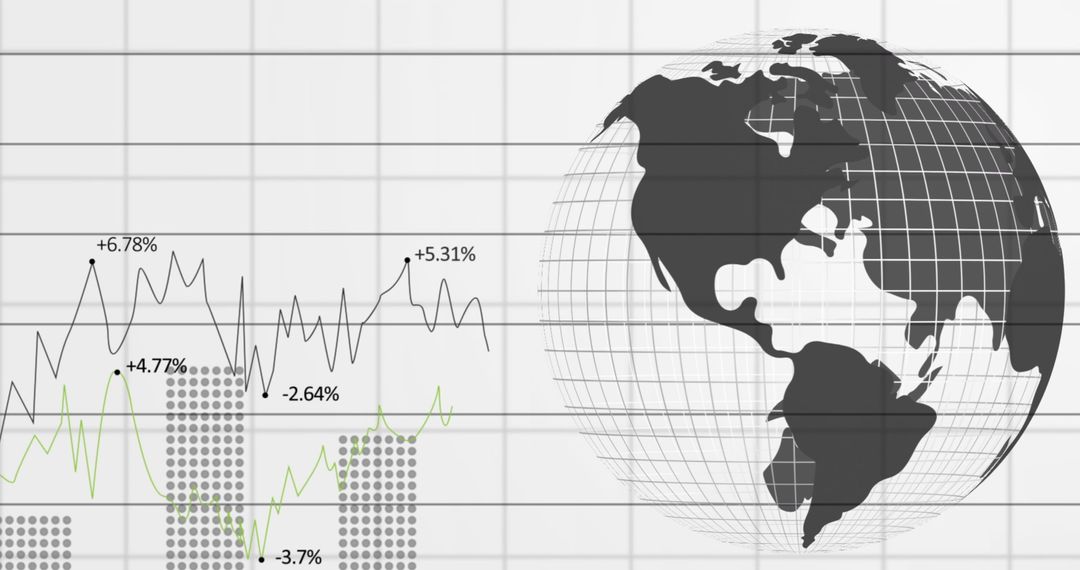
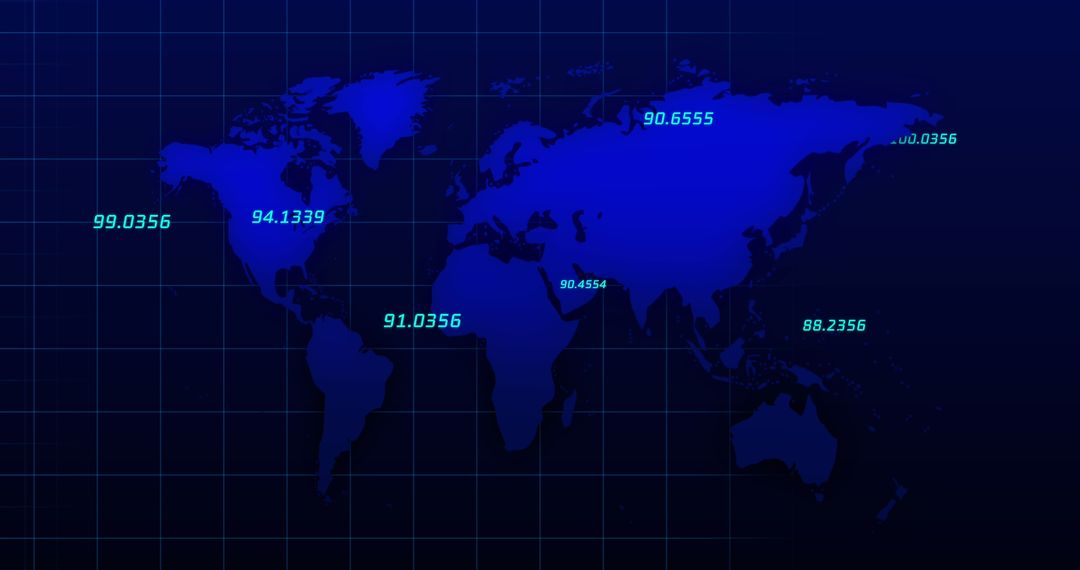
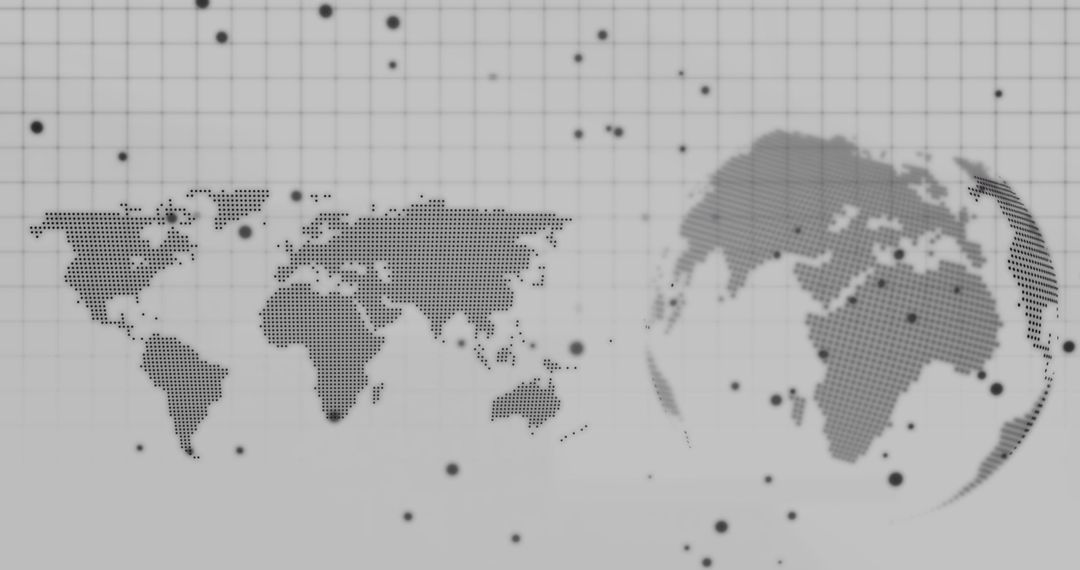
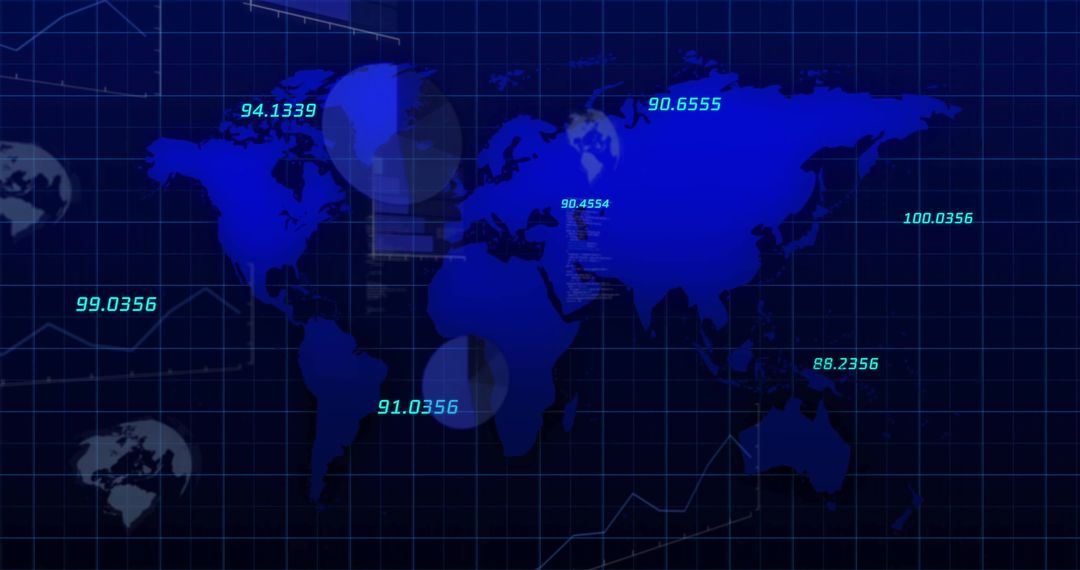
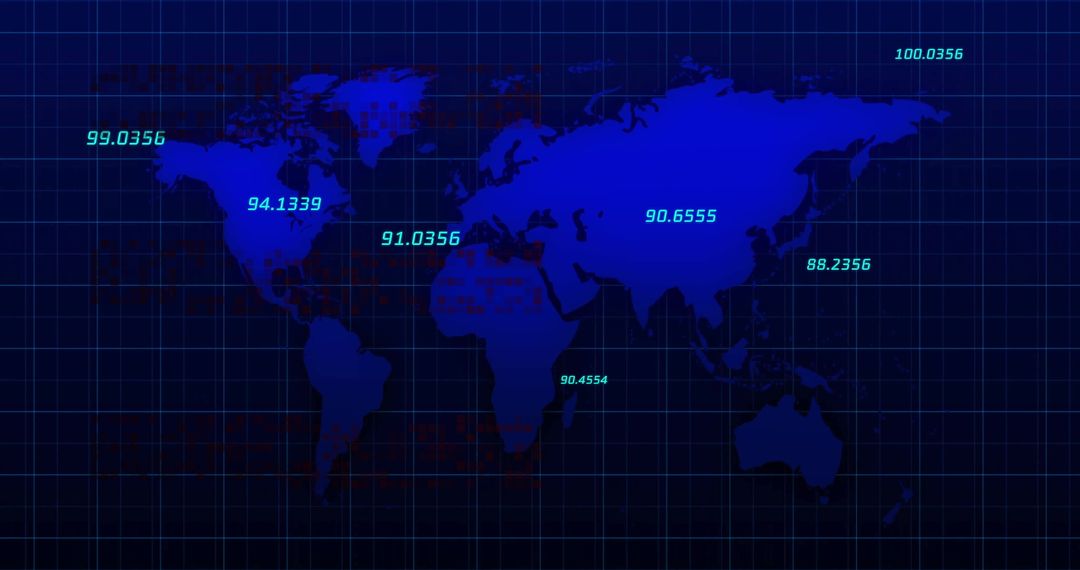
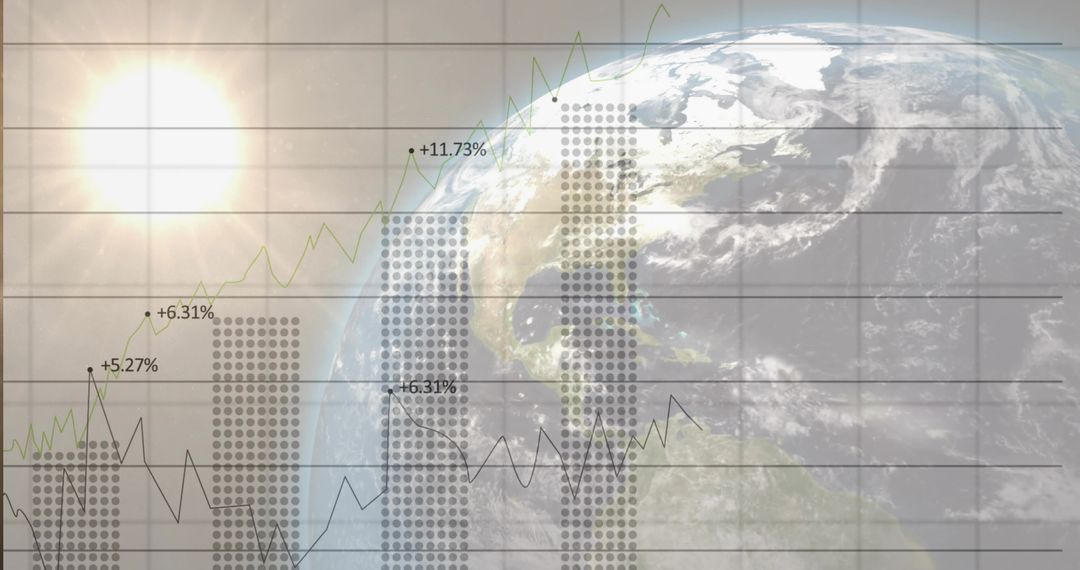
Displaying dotted world map and dotted globe over light gray grid with translucent blue pie charts, faint line graphs, floating black data nodes and semi-transparent panels. Design featuring minimalist tech aesthetic, high-contrast dots forming continental shapes and depth creating through blurred foreground and background elements. Serving global business reports, tech presentations, analytics dashboards, financial briefings, website headers and social media banners. Working well as background for corporate slides, annual reports, data-driven marketing materials and editorial illustrations about globalization and big data. Providing clean abstract space for overlaying text, icons and KPI numbers. Color palette centering on cool blues and grayscale, offering professional modern tone and strong contrast for white or dark typography. Ideal for tech startups, financial services, consulting firms, product launches and user interface mockups.
Powered by  - Get 15% off with code: PIKWIZARD15


0
downloads
downloads
Tags:
More
Credit Photo
If you would like to credit the Photo, here are some ways you can do so
Text Link
photo Link
<span class="text-link">
<span>
<a target="_blank" href=https://pikwizard.com/photo/dotted-world-map-and-globe-overlaying-abstract-global-data-visualization-with-blue-charts/de6721bd037b7bbaf5d4330331d1f6d7/>PikWizard</a>
</span>
</span>
<span class="image-link">
<span
style="margin: 0 0 20px 0; display: inline-block; vertical-align: middle; width: 100%;"
>
<a
target="_blank"
href="https://pikwizard.com/photo/dotted-world-map-and-globe-overlaying-abstract-global-data-visualization-with-blue-charts/de6721bd037b7bbaf5d4330331d1f6d7/"
style="text-decoration: none; font-size: 10px; margin: 0;"
>
<img src="https://pikwizard.com/pw/medium/de6721bd037b7bbaf5d4330331d1f6d7.jpg" style="margin: 0; width: 100%;" alt="" />
<p style="font-size: 12px; margin: 0;">PikWizard</p>
</a>
</span>
</span>
Free (free of charge)
Free for personal and commercial use.
Author: People Creations
Similar Free Stock Images

Premium


Premium


Premium


Premium


Premium


Premium


Premium


Premium


Premium


Premium


Premium


Premium


Premium


Premium


Premium


Premium


Premium


Premium


Premium


Premium


Premium


Premium


Premium


Premium