- Home >
- Stock Photos >
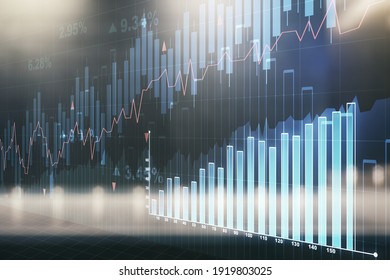
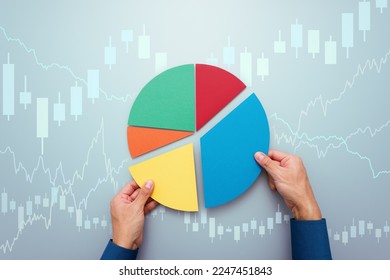
- Double Exposure of Candlestick Chart and Business Office
Double Exposure of Candlestick Chart and Business Office Image

The image combines elements of financial data analysis with an office backdrop. It features a double exposure of candlestick charts and an office environment, emphasizing the integration of data processing in business decisions. Ideal for illustrating financial reports, investment strategies, and technology-driven business solutions.
Powered by  - Get 15% off with code: PIKWIZARD15


2
downloads
downloads
Tags:
More
Credit Photo
If you would like to credit the Photo, here are some ways you can do so
Text Link
photo Link
<span class="text-link">
<span>
<a target="_blank" href=https://pikwizard.com/photo/double-exposure-of-candlestick-chart-and-business-office/6184841212f0350746099b6a4b8f5dfd/>PikWizard</a>
</span>
</span>
<span class="image-link">
<span
style="margin: 0 0 20px 0; display: inline-block; vertical-align: middle; width: 100%;"
>
<a
target="_blank"
href="https://pikwizard.com/photo/double-exposure-of-candlestick-chart-and-business-office/6184841212f0350746099b6a4b8f5dfd/"
style="text-decoration: none; font-size: 10px; margin: 0;"
>
<img src="https://pikwizard.com/pw/medium/6184841212f0350746099b6a4b8f5dfd.jpg" style="margin: 0; width: 100%;" alt="" />
<p style="font-size: 12px; margin: 0;">PikWizard</p>
</a>
</span>
</span>
Free (free of charge)
Free for personal and commercial use.
Author: People Creations
Similar Free Stock Images
Loading...

Premium


Premium

Premium


Premium


Premium

Premium


Premium


Premium


Premium

Premium


Premium

Premium


Premium


Premium


Premium


Premium


Premium

Premium

Premium


Premium

Premium


Premium
Premium

Premium

Premium