- Home >
- Stock Photos >
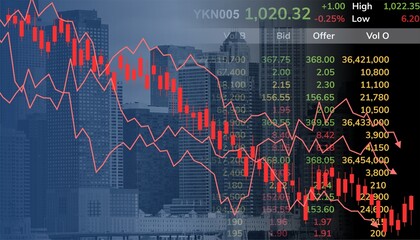
- Downward Stock Market Trends with Financial Data Graphs
Downward Stock Market Trends with Financial Data Graphs Image

Depicts red lines illustrating a declining trend in stock market data against a grid background. Useful for conveying economic downturns, financial analyses, or economic downturn-related discussions in presentations, articles, or reports.
Powered by 


2
downloads
downloads
Tags:
More
Credit Photo
If you would like to credit the Photo, here are some ways you can do so
Text Link
photo Link
<span class="text-link">
<span>
<a target="_blank" href=https://pikwizard.com/photo/downward-stock-market-trends-with-financial-data-graphs/9078155b4aa4aacf6e7392b0e4edbca9/>PikWizard</a>
</span>
</span>
<span class="image-link">
<span
style="margin: 0 0 20px 0; display: inline-block; vertical-align: middle; width: 100%;"
>
<a
target="_blank"
href="https://pikwizard.com/photo/downward-stock-market-trends-with-financial-data-graphs/9078155b4aa4aacf6e7392b0e4edbca9/"
style="text-decoration: none; font-size: 10px; margin: 0;"
>
<img src="https://pikwizard.com/pw/medium/9078155b4aa4aacf6e7392b0e4edbca9.jpg" style="margin: 0; width: 100%;" alt="" />
<p style="font-size: 12px; margin: 0;">PikWizard</p>
</a>
</span>
</span>
Free (free of charge)
Free for personal and commercial use.
Author: Authentic Images
Similar Free Stock Images
Loading...

Premium


Premium


Premium


Premium


Premium

Premium


Premium

Premium


Premium


Premium


Premium


Premium


Premium

Premium

Premium


Premium


Premium

Premium

Premium


Premium


Premium


Premium


Premium


Premium


Premium