- Home >
- Stock Photos >
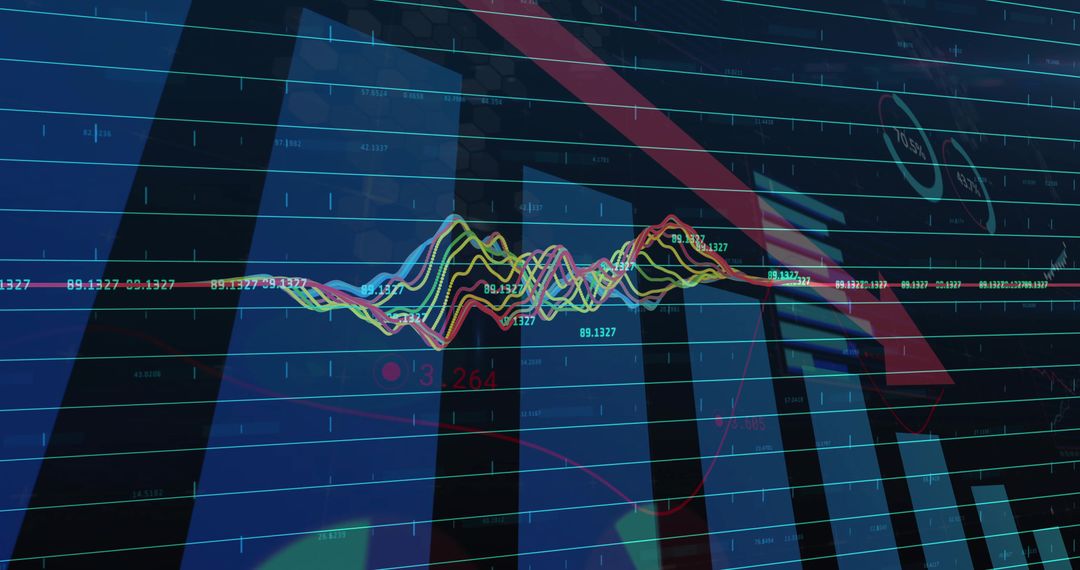
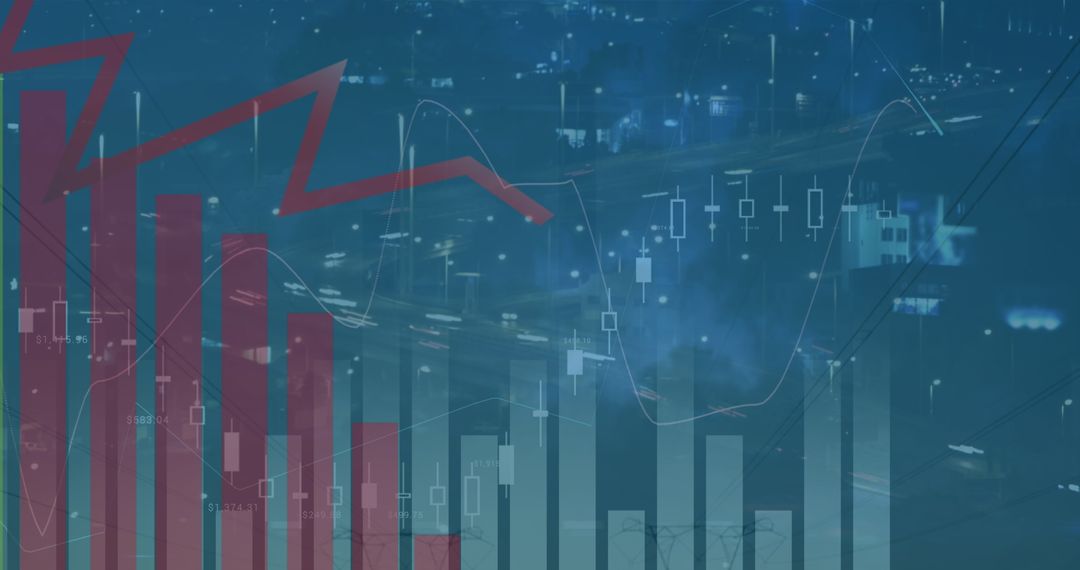
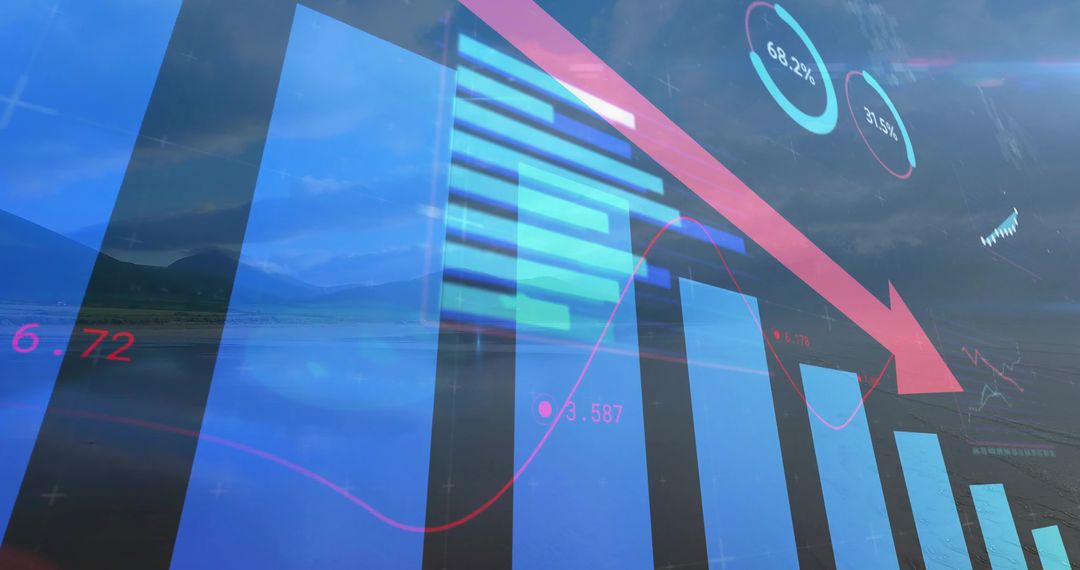
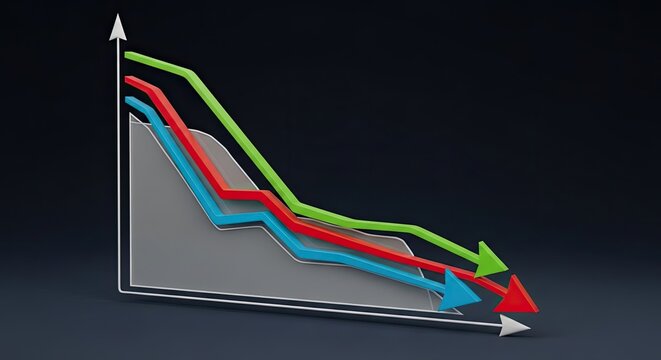
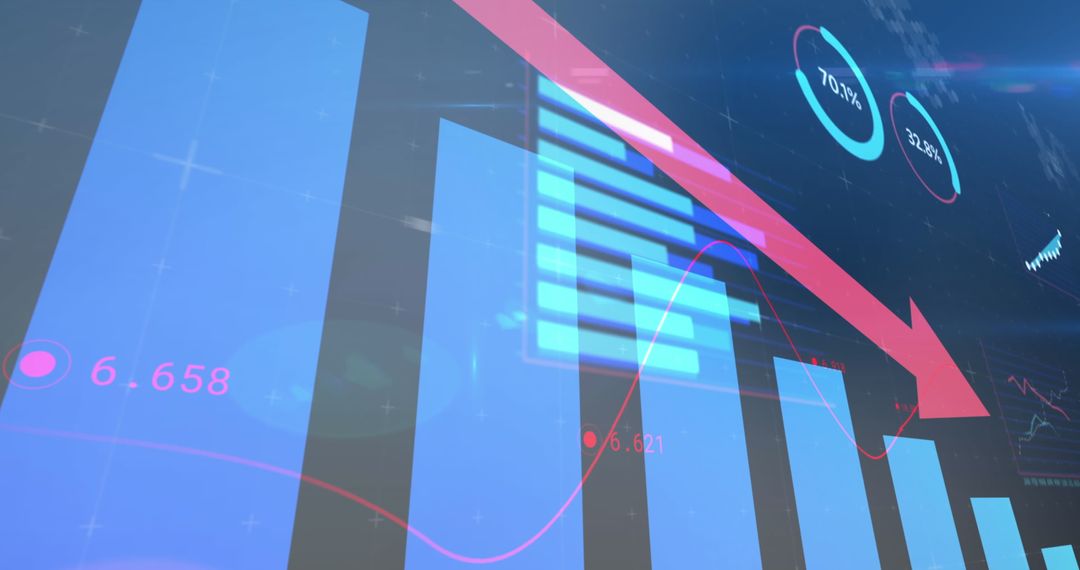
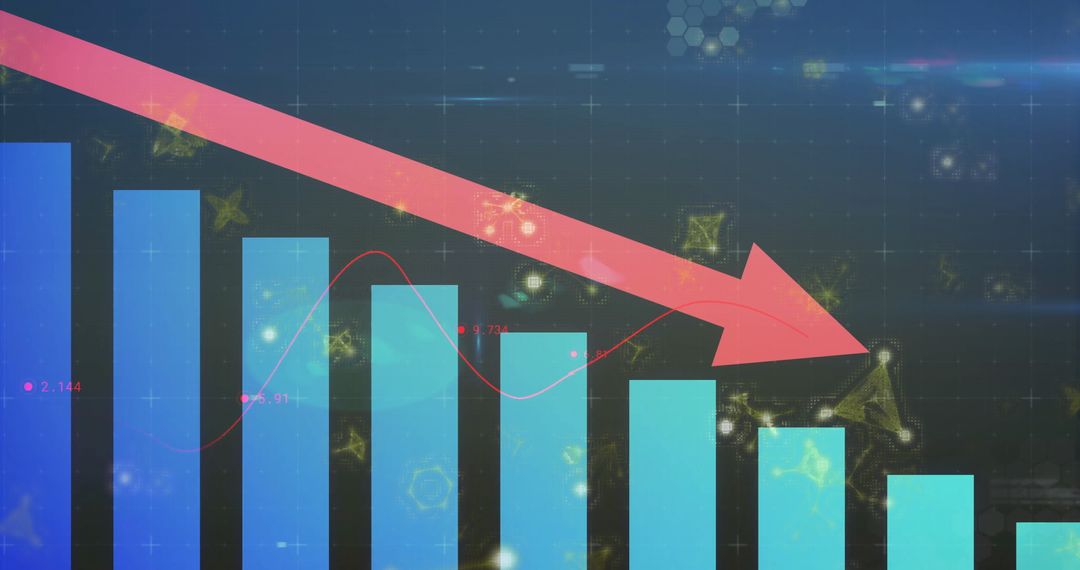
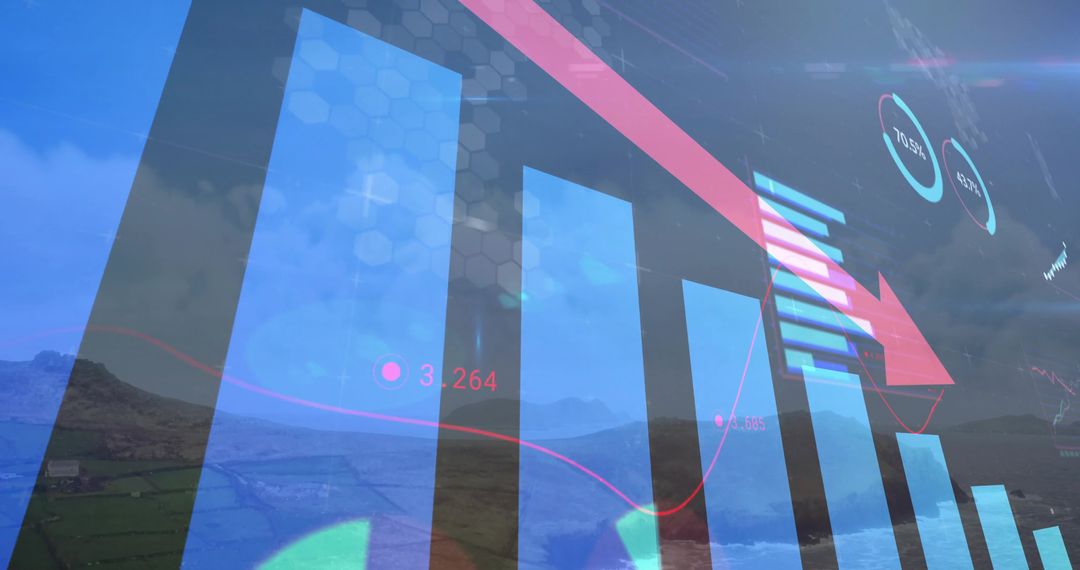
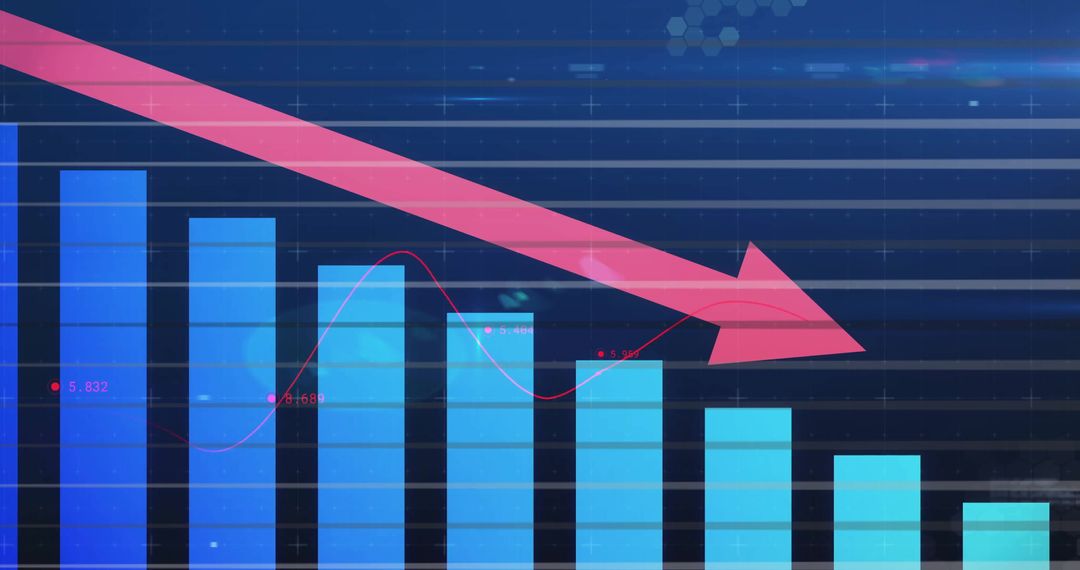
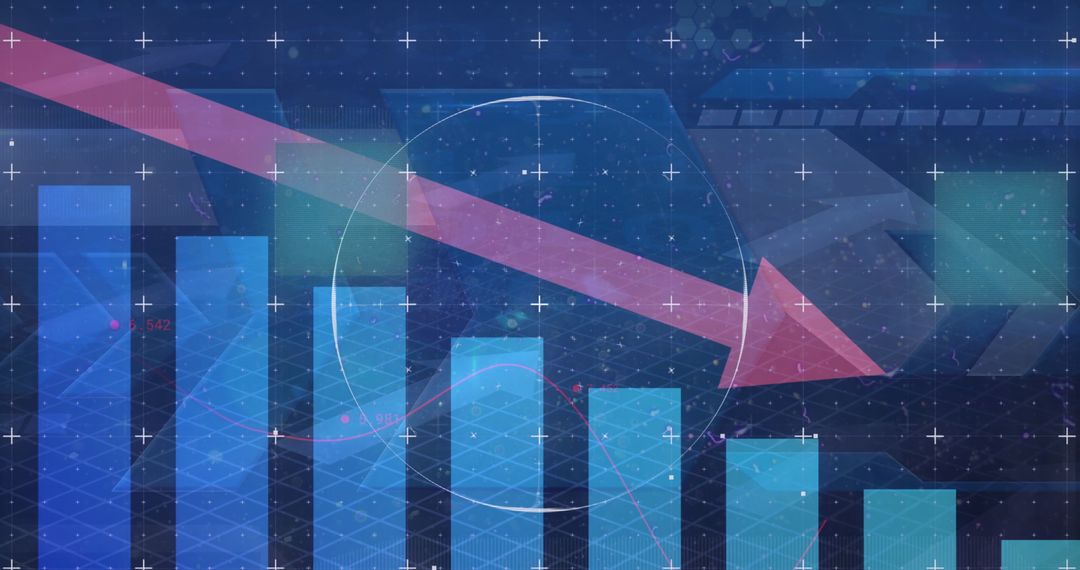
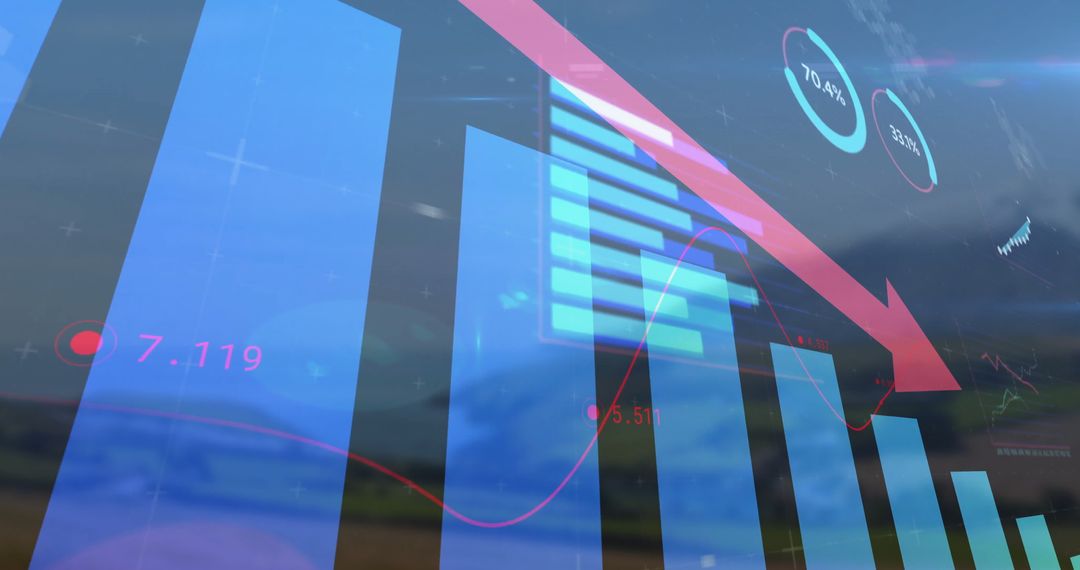
- Downward Trend Depicted with Red Arrow and Bar Graph on Digital Interface
Downward Trend Depicted with Red Arrow and Bar Graph on Digital Interface Image

This abstract representation using red arrow and bar graph communicates a downward trend or decline in data, ideal for breaking news about market behavior or analytical reports. The visuals imply technology and analytics, making it useful for presentations on economics and digital developments. Incorporate this in digital content or financial analyses, emphasizing the concept of decreased metrics or falling indices.
Powered by 


0
downloads
downloads
Tags:
More
Credit Photo
If you would like to credit the Photo, here are some ways you can do so
Text Link
photo Link
<span class="text-link">
<span>
<a target="_blank" href=https://pikwizard.com/photo/downward-trend-depicted-with-red-arrow-and-bar-graph-on-digital-interface/ce921701460f7737c2685ebdcaaa82b1/>PikWizard</a>
</span>
</span>
<span class="image-link">
<span
style="margin: 0 0 20px 0; display: inline-block; vertical-align: middle; width: 100%;"
>
<a
target="_blank"
href="https://pikwizard.com/photo/downward-trend-depicted-with-red-arrow-and-bar-graph-on-digital-interface/ce921701460f7737c2685ebdcaaa82b1/"
style="text-decoration: none; font-size: 10px; margin: 0;"
>
<img src="https://pikwizard.com/pw/medium/ce921701460f7737c2685ebdcaaa82b1.jpg" style="margin: 0; width: 100%;" alt="" />
<p style="font-size: 12px; margin: 0;">PikWizard</p>
</a>
</span>
</span>
Free (free of charge)
Free for personal and commercial use.
Author: Awesome Content
Similar Free Stock Images
Premium


Premium


Premium


Premium


Premium


Premium


Premium


Premium


Premium


Premium


Premium


Premium


Premium


Premium


Premium


Premium


Premium


Premium


Premium


Premium


Premium


Premium


Premium


Premium