- Home >
- Stock Photos >
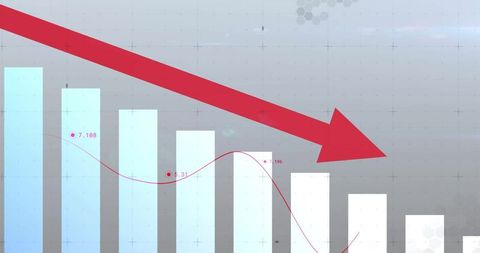
- Downward Trend in Financial Data Analysis Conceptual Illustration
Downward Trend in Financial Data Analysis Conceptual Illustration Image

Visualization of a declining trend in financial statistics, featuring a downward pointing red arrow amid various analytic graphs. Suitable for illustrating concepts of economic hardship, stock market declines, or downturns in financial results. Can be used in business reports, economic analysis presentations, or finance-related educational materials.
Powered by 


2
downloads
downloads
Tags:
More
Credit Photo
If you would like to credit the Photo, here are some ways you can do so
Text Link
photo Link
<span class="text-link">
<span>
<a target="_blank" href=https://pikwizard.com/photo/downward-trend-in-financial-data-analysis-conceptual-illustration/f73fb4a95b32479c6739dfafe160d735/>PikWizard</a>
</span>
</span>
<span class="image-link">
<span
style="margin: 0 0 20px 0; display: inline-block; vertical-align: middle; width: 100%;"
>
<a
target="_blank"
href="https://pikwizard.com/photo/downward-trend-in-financial-data-analysis-conceptual-illustration/f73fb4a95b32479c6739dfafe160d735/"
style="text-decoration: none; font-size: 10px; margin: 0;"
>
<img src="https://pikwizard.com/pw/medium/f73fb4a95b32479c6739dfafe160d735.jpg" style="margin: 0; width: 100%;" alt="" />
<p style="font-size: 12px; margin: 0;">PikWizard</p>
</a>
</span>
</span>
Free (free of charge)
Free for personal and commercial use.
Author: People Creations
Similar Free Stock Images

Premium


Premium


Premium


Premium


Premium


Premium


Premium


Premium


Premium


Premium


Premium


Premium


Premium


Premium


Premium


Premium


Premium


Premium


Premium


Premium


Premium


Premium


Premium


Premium


Premium