
- Home >
- Stock Photos >
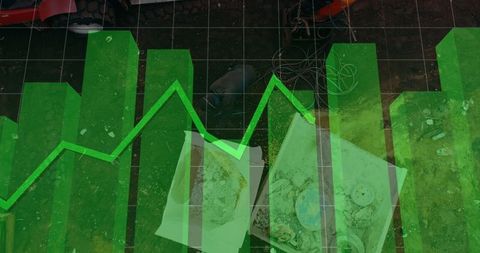
- Dynamic 3D Data Visualization with Fluctuating Graph
Dynamic 3D Data Visualization with Fluctuating Graph Image

This vibrant visualization features a dynamic 3D bar chart highlighted by a prominent jagged line, illustrating data fluctuations and analytics insights. Perfect for depicting market trends, technology presentations, and financial analysis. Effective for reports, business intelligence materials, and educational purposes in data science fields.
Powered by  - Get 15% off with code: PIKWIZARD15


downloads
Tags:
More
Credit Photo
If you would like to credit the Photo, here are some ways you can do so
Text Link
photo Link
<span class="text-link">
<span>
<a target="_blank" href=https://pikwizard.com/photo/dynamic-3d-data-visualization-with-fluctuating-graph/89dc43bbf8c3958783531ee40a6ab905/>PikWizard</a>
</span>
</span>
<span class="image-link">
<span
style="margin: 0 0 20px 0; display: inline-block; vertical-align: middle; width: 100%;"
>
<a
target="_blank"
href="https://pikwizard.com/photo/dynamic-3d-data-visualization-with-fluctuating-graph/89dc43bbf8c3958783531ee40a6ab905/"
style="text-decoration: none; font-size: 10px; margin: 0;"
>
<img src="https://pikwizard.com/pw/medium/89dc43bbf8c3958783531ee40a6ab905.jpg" style="margin: 0; width: 100%;" alt="" />
<p style="font-size: 12px; margin: 0;">PikWizard</p>
</a>
</span>
</span>
Free (free of charge)
Free for personal and commercial use.
Author: Creative Art
Similar Free Stock Images

Premium


Premium


Premium


Premium


Premium


Premium


Premium


Premium


Premium

Premium

Premium


Premium


Premium


Premium


Premium


Premium


Premium


Premium


Premium


Premium

Premium


Premium


Premium


Premium

Premium


Explore More Free Stock Images