
- Home >
- Stock Photos >
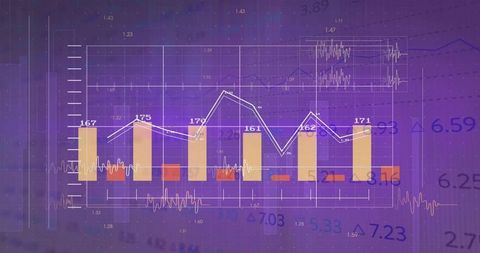
- Dynamic 3D Graph Analytics with Red and Blue Bars
Dynamic 3D Graph Analytics with Red and Blue Bars Image

This visualization showcases a futuristic 3D graph with vibrant color contrasts, utilizing red and blue bars to represent data points alongside overlaying line graphs with percentages. A blue arrow departs from the grid, adding depth and dimension to this analytical depiction. Useful for illustrating financial reports, business strategy analytics, statistical data presentations, and educational purposes in economics or market trend analysis demonstrations.
Powered by 


downloads
Tags:
More
Credit Photo
If you would like to credit the Photo, here are some ways you can do so
Text Link
photo Link
<span class="text-link">
<span>
<a target="_blank" href=https://pikwizard.com/photo/dynamic-3d-graph-analytics-with-red-and-blue-bars/dbe5638a8c4da1ea491faaa8794b0a37/>PikWizard</a>
</span>
</span>
<span class="image-link">
<span
style="margin: 0 0 20px 0; display: inline-block; vertical-align: middle; width: 100%;"
>
<a
target="_blank"
href="https://pikwizard.com/photo/dynamic-3d-graph-analytics-with-red-and-blue-bars/dbe5638a8c4da1ea491faaa8794b0a37/"
style="text-decoration: none; font-size: 10px; margin: 0;"
>
<img src="https://pikwizard.com/pw/medium/dbe5638a8c4da1ea491faaa8794b0a37.jpg" style="margin: 0; width: 100%;" alt="" />
<p style="font-size: 12px; margin: 0;">PikWizard</p>
</a>
</span>
</span>
Free (free of charge)
Free for personal and commercial use.
Author: Creative Art
Similar Free Stock Images

Premium


Premium

Premium


Premium


Premium


Premium


Premium


Premium


Premium

Premium

Premium


Premium

Premium


Premium


Premium


Premium

Premium


Premium


Premium


Premium


Premium

Premium


Premium

Premium

Premium


Explore More Free Stock Images