
- Home >
- Stock Photos >
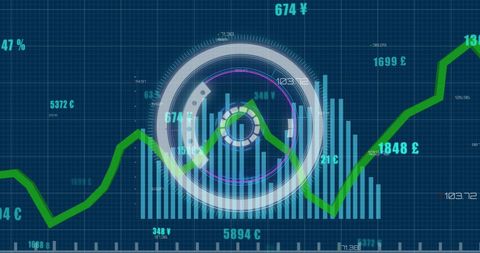
- Dynamic 3D Line Graph with Colored Pins Depicting Data Analysis Progress
Dynamic 3D Line Graph with Colored Pins Depicting Data Analysis Progress Image

AI
AI Generated Image. Illustrating the journey of business growth, this dynamic depiction offers potential for use in presentations and reports on market analysis, financial trends, or AI-prediction outcomes. Vivid colors and 3D effects add a contemporary touch, ideal for digital platforms or visual marketing materials.

downloads
Tags:
More
Credit Photo
If you would like to credit the Photo, here are some ways you can do so
Text Link
photo Link
<span class="text-link">
<span>
<a target="_blank" href=https://pikwizard.com/photo/dynamic-3d-line-graph-with-colored-pins-depicting-data-analysis-progress/e9aca400caf352e0a7500199ae5fa8b6/>PikWizard</a>
</span>
</span>
<span class="image-link">
<span
style="margin: 0 0 20px 0; display: inline-block; vertical-align: middle; width: 100%;"
>
<a
target="_blank"
href="https://pikwizard.com/photo/dynamic-3d-line-graph-with-colored-pins-depicting-data-analysis-progress/e9aca400caf352e0a7500199ae5fa8b6/"
style="text-decoration: none; font-size: 10px; margin: 0;"
>
<img src="https://pikwizard.com/pw/medium/e9aca400caf352e0a7500199ae5fa8b6.jpg" style="margin: 0; width: 100%;" alt="" />
<p style="font-size: 12px; margin: 0;">PikWizard</p>
</a>
</span>
</span>
Free (free of charge)
Free for personal and commercial use.
Author: AI Creator
Similar Free Stock Images


AI

AI


AI


AI

AI


AI


AI


AI


Explore More Free Stock Images