
- Home >
- Stock Photos >
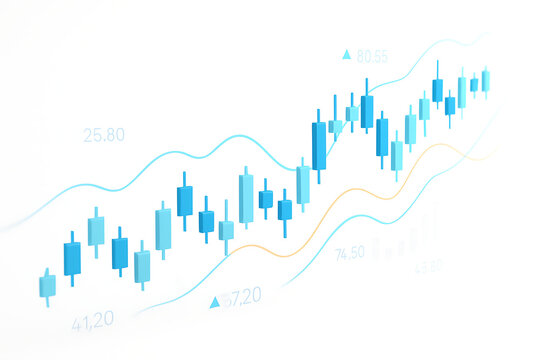
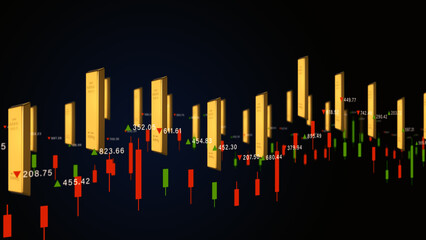
- Dynamic 3D Stock Market Data Visualization with Trends
Dynamic 3D Stock Market Data Visualization with Trends Image

Dynamic 3D depiction of stock market analytics featuring blue candlesticks and colorful trend lines atop numeric indicators. Perfect for conveying concepts like financial forecasting, data-driven decision making, stock market analysis, technological integration, and modern analytic techniques. Useful for finance-related projects, digital dashboards, and economic presentations.
Powered by 


downloads
Tags:
More
Credit Photo
If you would like to credit the Photo, here are some ways you can do so
Text Link
photo Link
<span class="text-link">
<span>
<a target="_blank" href=https://pikwizard.com/photo/dynamic-3d-stock-market-data-visualization-with-trends/1e059a7ecbc49d34dc1d3c5ee7ebd3af/>PikWizard</a>
</span>
</span>
<span class="image-link">
<span
style="margin: 0 0 20px 0; display: inline-block; vertical-align: middle; width: 100%;"
>
<a
target="_blank"
href="https://pikwizard.com/photo/dynamic-3d-stock-market-data-visualization-with-trends/1e059a7ecbc49d34dc1d3c5ee7ebd3af/"
style="text-decoration: none; font-size: 10px; margin: 0;"
>
<img src="https://pikwizard.com/pw/medium/1e059a7ecbc49d34dc1d3c5ee7ebd3af.jpg" style="margin: 0; width: 100%;" alt="" />
<p style="font-size: 12px; margin: 0;">PikWizard</p>
</a>
</span>
</span>
Free (free of charge)
Free for personal and commercial use.
Author: Authentic Images
Similar Free Stock Images

Premium


Premium


Premium

Premium


Premium


Premium


Premium


Premium


Premium


Premium


Premium


Premium


Premium


Premium


Premium

Premium


Premium

Premium


Premium


Premium
Premium


Premium


Premium

Premium


Premium


Explore More Free Stock Images