
- Home >
- Stock Photos >
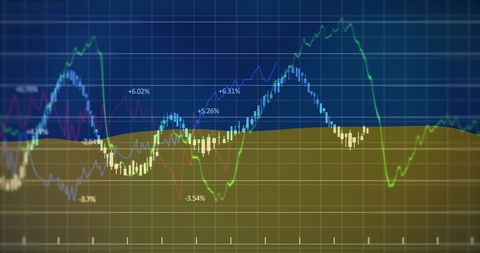
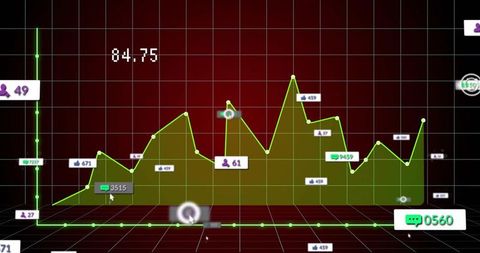
- Dynamic Analytics Chart with Colored Area Segments and Data Values
Dynamic Analytics Chart with Colored Area Segments and Data Values Image

Dynamic visualization displaying complex dataset through colored area charts. Ideal for business presentations, dashboards, reports, and analytics projects needing clear data insights.
Powered by  - Get 15% off with code: PIKWIZARD15


downloads
Tags:
More
Credit Photo
If you would like to credit the Photo, here are some ways you can do so
Text Link
photo Link
<span class="text-link">
<span>
<a target="_blank" href=https://pikwizard.com/photo/dynamic-analytics-chart-with-colored-area-segments-and-data-values/0e711f9e1a9c244a02ecb318d423c432/>PikWizard</a>
</span>
</span>
<span class="image-link">
<span
style="margin: 0 0 20px 0; display: inline-block; vertical-align: middle; width: 100%;"
>
<a
target="_blank"
href="https://pikwizard.com/photo/dynamic-analytics-chart-with-colored-area-segments-and-data-values/0e711f9e1a9c244a02ecb318d423c432/"
style="text-decoration: none; font-size: 10px; margin: 0;"
>
<img src="https://pikwizard.com/pw/medium/0e711f9e1a9c244a02ecb318d423c432.jpg" style="margin: 0; width: 100%;" alt="" />
<p style="font-size: 12px; margin: 0;">PikWizard</p>
</a>
</span>
</span>
Free (free of charge)
Free for personal and commercial use.
Author: People Creations
Similar Free Stock Images

Premium


Premium

Premium


Premium


Premium


Premium


Premium

Premium


Premium


AI

Premium


Premium


Premium


Premium


Premium

Premium

Premium


Premium

Premium


Premium


Premium

Premium


Premium

Premium

Premium

Premium


Explore More Free Stock Images