
- Home >
- Stock Photos >
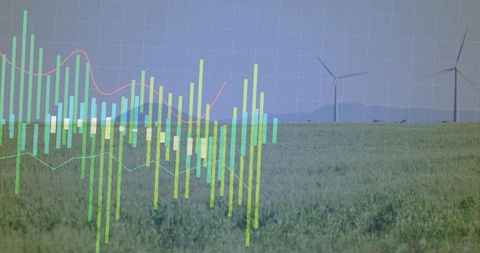
- Dynamic Analytics Dashboard Visualizing Business Metrics
Dynamic Analytics Dashboard Visualizing Business Metrics Image

The vibrant display of an analytics dashboard with overlapping multicolored bars, numeric metrics, and a red line graph against a grid background illustrates sophisticated data analytics tools. This scene is impactful for presentations on business intelligence strategies, enhancements in data collection methods, or cutting-edge technology discussions. Marketers, data analysts, and tech professionals might use it to depict concepts surrounding performance analysis and result tracking.
Powered by 


downloads
Tags:
More
Credit Photo
If you would like to credit the Photo, here are some ways you can do so
Text Link
photo Link
<span class="text-link">
<span>
<a target="_blank" href=https://pikwizard.com/photo/dynamic-analytics-dashboard-visualizing-business-metrics/aa0a2b6a24a8ca339c565dda0f2ea15b/>PikWizard</a>
</span>
</span>
<span class="image-link">
<span
style="margin: 0 0 20px 0; display: inline-block; vertical-align: middle; width: 100%;"
>
<a
target="_blank"
href="https://pikwizard.com/photo/dynamic-analytics-dashboard-visualizing-business-metrics/aa0a2b6a24a8ca339c565dda0f2ea15b/"
style="text-decoration: none; font-size: 10px; margin: 0;"
>
<img src="https://pikwizard.com/pw/medium/aa0a2b6a24a8ca339c565dda0f2ea15b.jpg" style="margin: 0; width: 100%;" alt="" />
<p style="font-size: 12px; margin: 0;">PikWizard</p>
</a>
</span>
</span>
Free (free of charge)
Free for personal and commercial use.
Author: Creative Art
Similar Free Stock Images

Premium


Premium

Premium


Premium


Premium


Premium


Premium


Premium

Premium


Premium


Premium


Premium


Premium


Premium


Premium


Premium


Premium


Premium

Premium


Premium


Premium

Premium


Premium

Premium

Premium

Explore More Free Stock Images