- Home >
- Stock Photos >
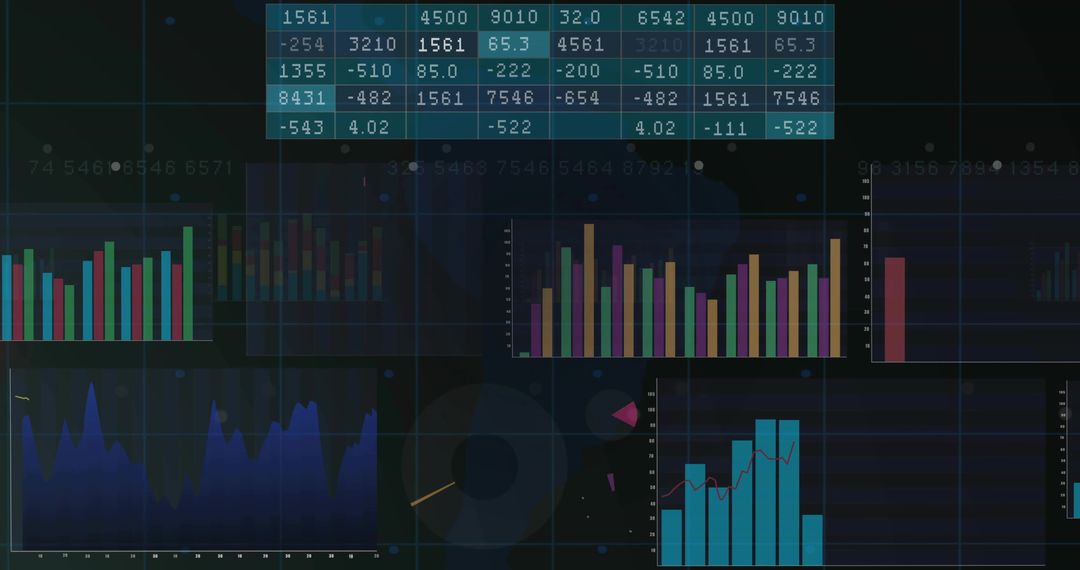
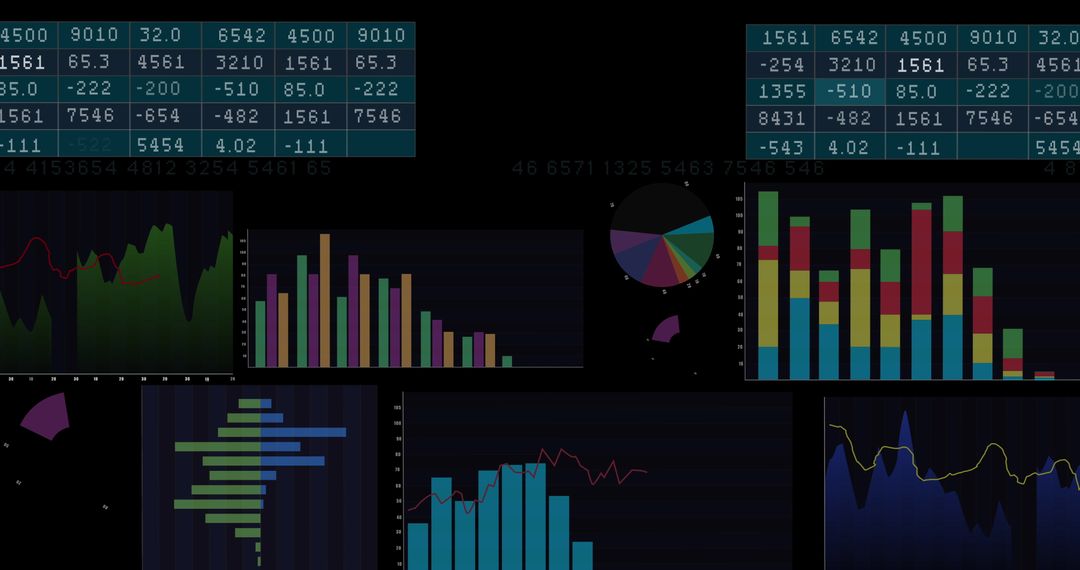
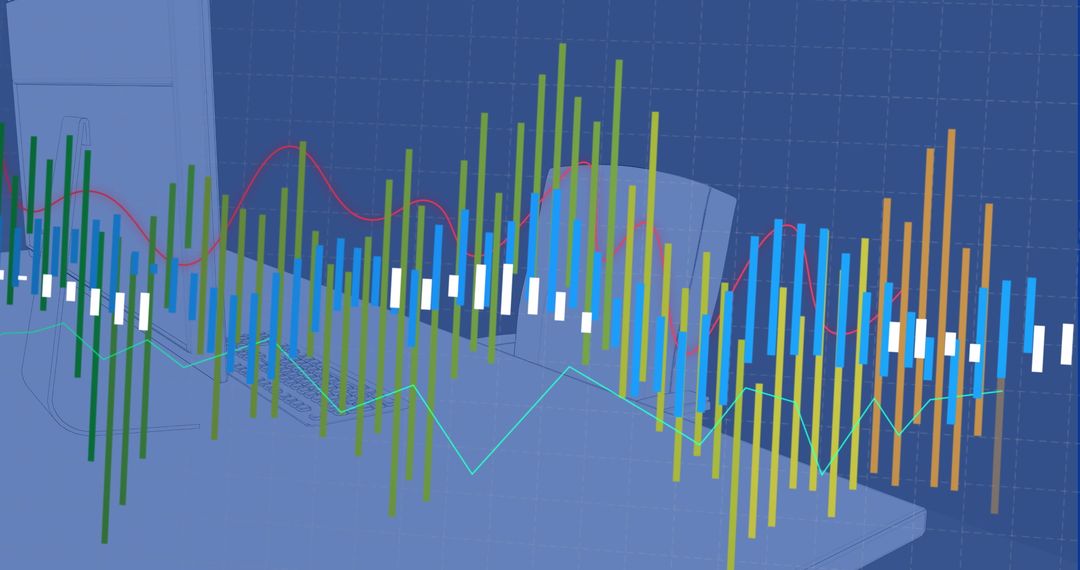
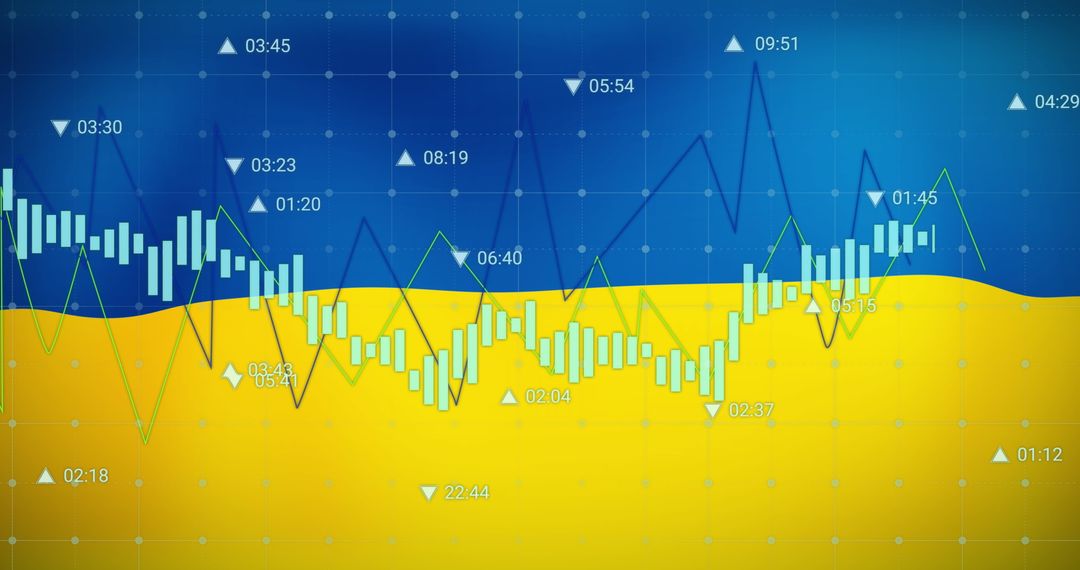
- Dynamic Bar and Line Chart on Modern Analytics Dashboard
Dynamic Bar and Line Chart on Modern Analytics Dashboard Image

Graphic displaying vertical bars and line traces overlaid with numbers, conveying a financial or business intelligence context. Ideal for use in presentations about data analytics, finance sectors, corporate digital tools, strategic business planning, or technology in business management. Usable in articles around modern data visualization techniques and trend analyses.
Powered by  - Get 15% off with code: PIKWIZARD15


0
downloads
downloads
Tags:
More
Credit Photo
If you would like to credit the Photo, here are some ways you can do so
Text Link
photo Link
<span class="text-link">
<span>
<a target="_blank" href=https://pikwizard.com/photo/dynamic-bar-and-line-chart-on-modern-analytics-dashboard/6d6cb819b7850b496daed3fa7b9a520c/>PikWizard</a>
</span>
</span>
<span class="image-link">
<span
style="margin: 0 0 20px 0; display: inline-block; vertical-align: middle; width: 100%;"
>
<a
target="_blank"
href="https://pikwizard.com/photo/dynamic-bar-and-line-chart-on-modern-analytics-dashboard/6d6cb819b7850b496daed3fa7b9a520c/"
style="text-decoration: none; font-size: 10px; margin: 0;"
>
<img src="https://pikwizard.com/pw/medium/6d6cb819b7850b496daed3fa7b9a520c.jpg" style="margin: 0; width: 100%;" alt="" />
<p style="font-size: 12px; margin: 0;">PikWizard</p>
</a>
</span>
</span>
Free (free of charge)
Free for personal and commercial use.
Author: Awesome Content
Similar Free Stock Images

Premium


Premium


Premium


Premium


Premium


Premium


Premium


Premium


Premium


Premium


Premium


Premium


Premium


Premium


Premium


Premium


Premium


Premium


Premium


Premium


Premium


Premium


Premium


Premium