- Home >
- Stock Photos >
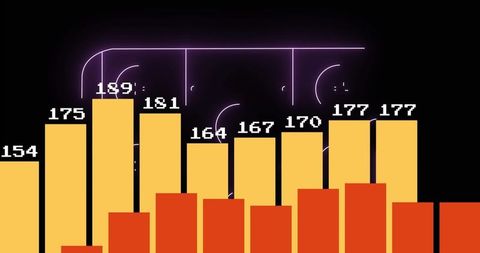
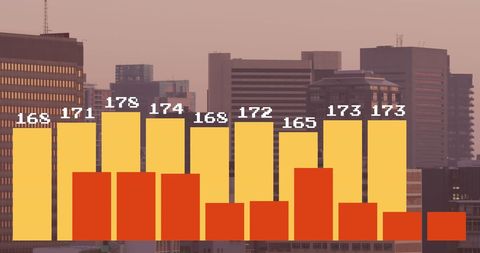
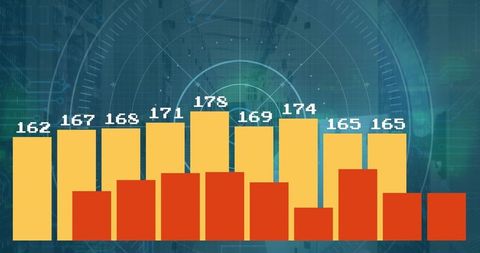
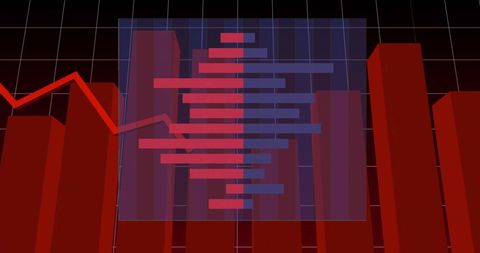
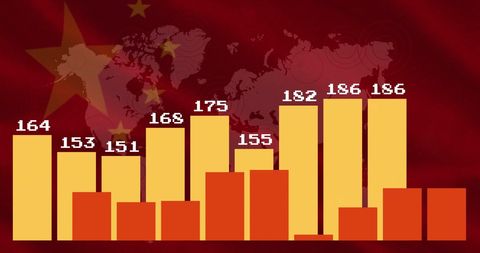
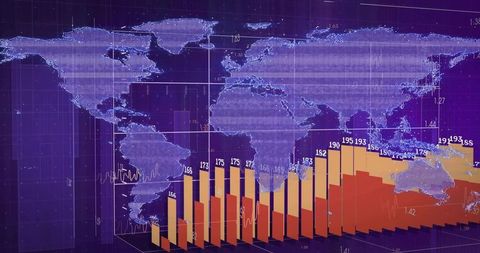
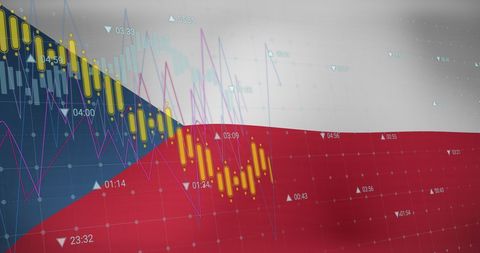
- Dynamic Bar Chart on Digital Red Background
Dynamic Bar Chart on Digital Red Background Image
Bar chart illustrating varied data values set against a red digital backdrop creates a modern, tech-focused aesthetic. Overlaying numbers enhance the effect of real-time data analytics. Ideal for presentations on business analytics, finance reports, or informational infographics emphasizing data-driven discussions.

downloads
Tags:
More
Credit Photo
If you would like to credit the Photo, here are some ways you can do so
Text Link
photo Link
<span class="text-link">
<span>
<a target="_blank" href=https://pikwizard.com/photo/dynamic-bar-chart-on-digital-red-background/ef00bf77b84ac62e1c03c9fe72ac1c5d/>PikWizard</a>
</span>
</span>
<span class="image-link">
<span
style="margin: 0 0 20px 0; display: inline-block; vertical-align: middle; width: 100%;"
>
<a
target="_blank"
href="https://pikwizard.com/photo/dynamic-bar-chart-on-digital-red-background/ef00bf77b84ac62e1c03c9fe72ac1c5d/"
style="text-decoration: none; font-size: 10px; margin: 0;"
>
<img src="https://pikwizard.com/pw/medium/ef00bf77b84ac62e1c03c9fe72ac1c5d.jpg" style="margin: 0; width: 100%;" alt="" />
<p style="font-size: 12px; margin: 0;">PikWizard</p>
</a>
</span>
</span>
Free (free of charge)
Free for personal and commercial use.
Author: People Creations