
- Home >
- Stock Photos >
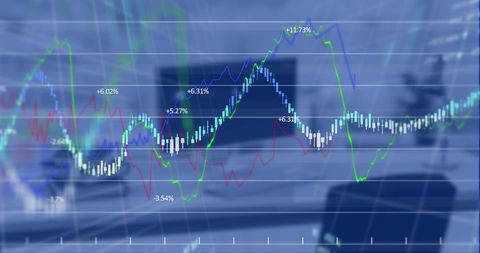
- Dynamic Business Analysis with Global Digital Interface Figures
Dynamic Business Analysis with Global Digital Interface Figures Image

Featuring overlay of financial growth graph against background of blurred diverse business people walking. Illustrating global business and modern data analysis, useful for articles on finance, global economy, investments, market trends or presentations on digital data insights and business strategies.
Powered by 


downloads
Tags:
More
Credit Photo
If you would like to credit the Photo, here are some ways you can do so
Text Link
photo Link
<span class="text-link">
<span>
<a target="_blank" href=https://pikwizard.com/photo/dynamic-business-analysis-with-global-digital-interface-figures/e8ee7ee19e1bf315a330952acea84ac0/>PikWizard</a>
</span>
</span>
<span class="image-link">
<span
style="margin: 0 0 20px 0; display: inline-block; vertical-align: middle; width: 100%;"
>
<a
target="_blank"
href="https://pikwizard.com/photo/dynamic-business-analysis-with-global-digital-interface-figures/e8ee7ee19e1bf315a330952acea84ac0/"
style="text-decoration: none; font-size: 10px; margin: 0;"
>
<img src="https://pikwizard.com/pw/medium/e8ee7ee19e1bf315a330952acea84ac0.jpg" style="margin: 0; width: 100%;" alt="" />
<p style="font-size: 12px; margin: 0;">PikWizard</p>
</a>
</span>
</span>
Free (free of charge)
Free for personal and commercial use.
Author: Awesome Content
Similar Free Stock Images

Premium


Premium


Premium


Premium


Premium


Premium

Premium


Premium

Premium


Premium


Premium


Premium


Premium


Premium

Premium

Premium


Premium


Premium


Premium


Premium


Premium

Premium


Premium


Premium


Premium


Explore More Free Stock Images