- Home >
- Stock Photos >
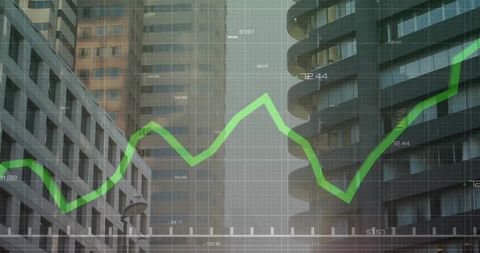
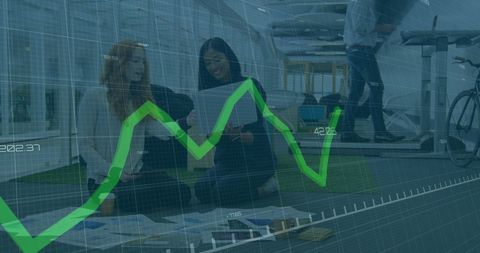
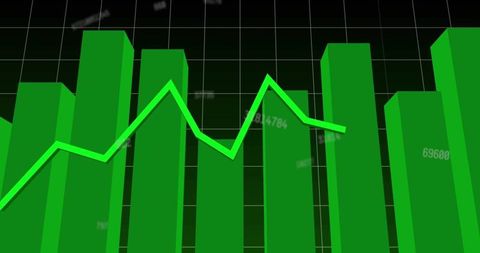
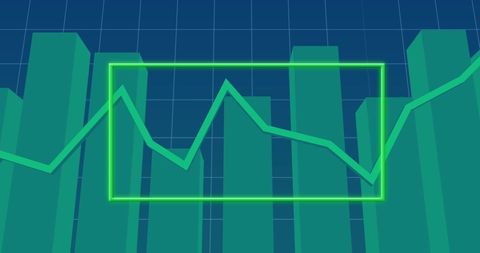
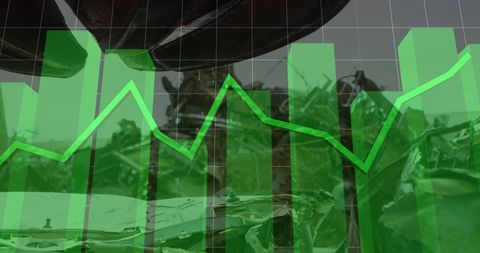
- Dynamic Business Analytics and Data Processing Visualization
Dynamic Business Analytics and Data Processing Visualization Image

Combines elements of personal contemplation symbolized by a figure in a car with dynamic data visualization using digital analytics and green bars. This scene conveys a futuristic perspective on business data processing, financial growth, and market analysis. Perfect for illustrating articles on economic statistics, technological integration in business strategy, and data-driven decision-making in a corporate environment.

downloads
Tags:
More
Credit Photo
If you would like to credit the Photo, here are some ways you can do so
Text Link
photo Link
<span class="text-link">
<span>
<a target="_blank" href=https://pikwizard.com/photo/dynamic-business-analytics-and-data-processing-visualization/a88e0ec136a1cc710378dc3d1eea4896/>PikWizard</a>
</span>
</span>
<span class="image-link">
<span
style="margin: 0 0 20px 0; display: inline-block; vertical-align: middle; width: 100%;"
>
<a
target="_blank"
href="https://pikwizard.com/photo/dynamic-business-analytics-and-data-processing-visualization/a88e0ec136a1cc710378dc3d1eea4896/"
style="text-decoration: none; font-size: 10px; margin: 0;"
>
<img src="https://pikwizard.com/pw/medium/a88e0ec136a1cc710378dc3d1eea4896.jpg" style="margin: 0; width: 100%;" alt="" />
<p style="font-size: 12px; margin: 0;">PikWizard</p>
</a>
</span>
</span>
Free (free of charge)
Free for personal and commercial use.
Author: Authentic Images