
- Home >
- Stock Photos >
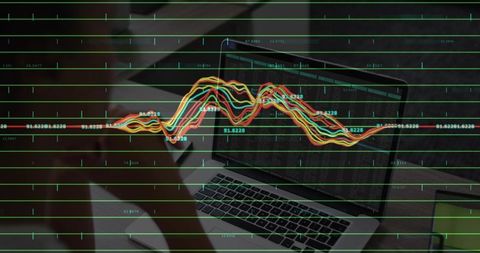
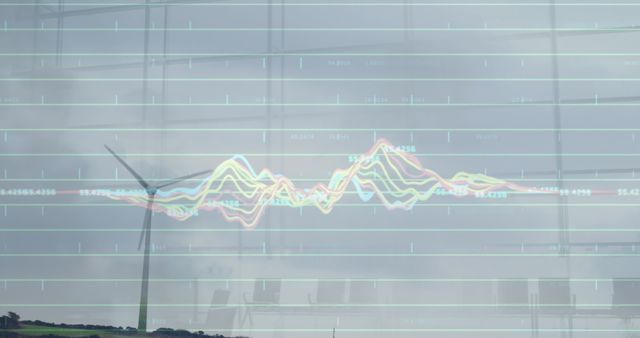
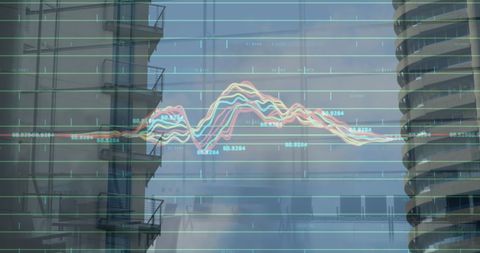
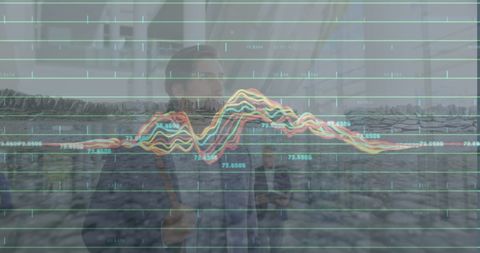
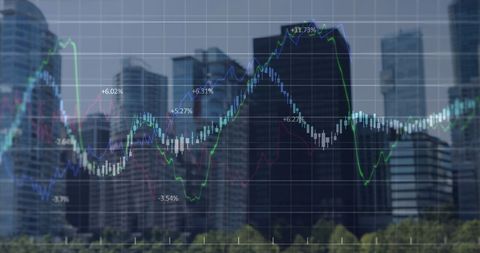
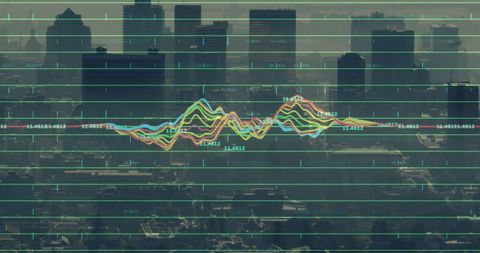
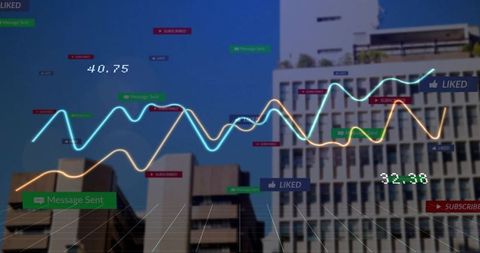
- Dynamic Business Data Visualization on Modern Office Building
Dynamic Business Data Visualization on Modern Office Building Image
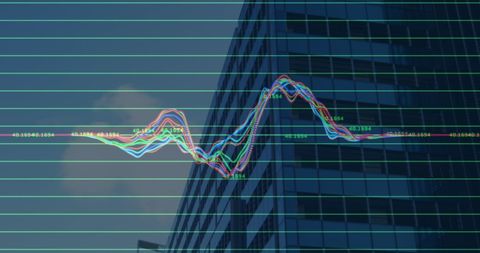
Digitally generated image showcasing fluctuating financial graphs over a modern office structure. Highlights the intersection of technology and business, symbolizing progress and financial analysis. Ideal for use in articles, videos, and presentations focusing on financial markets, digital infrastructure, or corporate environments, encapsulating the fast-paced world of business analytics.
Powered by 


downloads
Tags:
More
Credit Photo
If you would like to credit the Photo, here are some ways you can do so
Text Link
photo Link
<span class="text-link">
<span>
<a target="_blank" href=https://pikwizard.com/photo/dynamic-business-data-visualization-on-modern-office-building/da6230ebda7eeeabd09cc7778f6979a7/>PikWizard</a>
</span>
</span>
<span class="image-link">
<span
style="margin: 0 0 20px 0; display: inline-block; vertical-align: middle; width: 100%;"
>
<a
target="_blank"
href="https://pikwizard.com/photo/dynamic-business-data-visualization-on-modern-office-building/da6230ebda7eeeabd09cc7778f6979a7/"
style="text-decoration: none; font-size: 10px; margin: 0;"
>
<img src="https://pikwizard.com/pw/medium/da6230ebda7eeeabd09cc7778f6979a7.jpg" style="margin: 0; width: 100%;" alt="" />
<p style="font-size: 12px; margin: 0;">PikWizard</p>
</a>
</span>
</span>
Free (free of charge)
Free for personal and commercial use.
Author: Creative Art
Similar Free Stock Images

Premium


Premium

Premium


Premium

Premium


Premium


Premium


Premium


Premium

Premium


Premium


Premium


Premium


Premium


Premium


Premium

Premium


Premium

Premium


Premium


Premium


Premium


Premium


Premium


Premium

Explore More Free Stock Images