
- Home >
- Stock Photos >
- Dynamic Business Data Visualization with Graphs and Desk
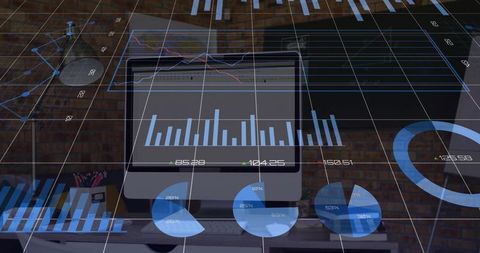
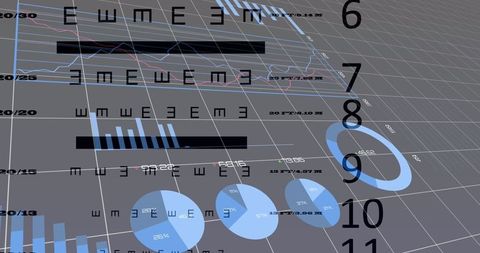
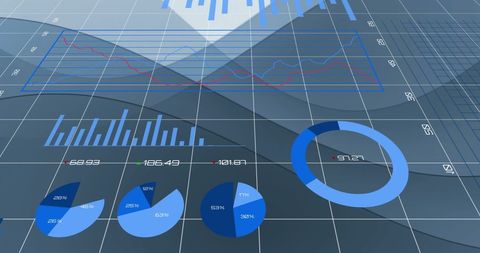
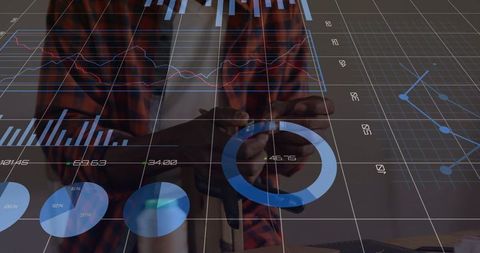
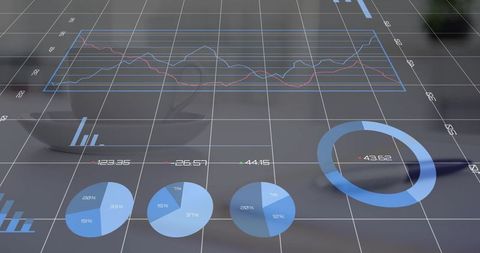
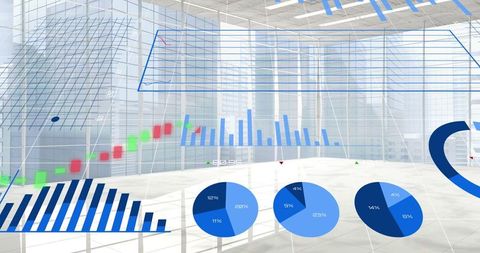
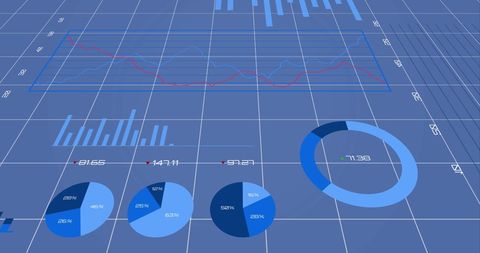
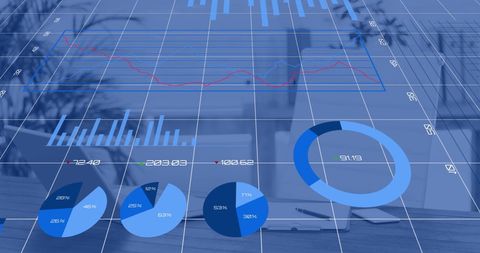
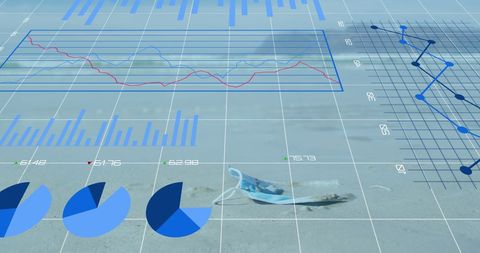
Dynamic Business Data Visualization with Graphs and Desk Image

Graphic design shows dynamic data visualization incorporating multiple graphs and changing numbers, set over a desk with a computer in the background. Ideal for materials focused on technological advances, business growth strategies, and analytical reporting. Effective for marketing presentations, business reports, and tech-oriented educational materials.
Powered by  - Get 15% off with code: PIKWIZARD15


downloads
Tags:
More
Credit Photo
If you would like to credit the Photo, here are some ways you can do so
Text Link
photo Link
<span class="text-link">
<span>
<a target="_blank" href=https://pikwizard.com/photo/dynamic-business-data-visualization-with-graphs-and-desk/d1f16acd5facf87ffe5738c44bbf2795/>PikWizard</a>
</span>
</span>
<span class="image-link">
<span
style="margin: 0 0 20px 0; display: inline-block; vertical-align: middle; width: 100%;"
>
<a
target="_blank"
href="https://pikwizard.com/photo/dynamic-business-data-visualization-with-graphs-and-desk/d1f16acd5facf87ffe5738c44bbf2795/"
style="text-decoration: none; font-size: 10px; margin: 0;"
>
<img src="https://pikwizard.com/pw/medium/d1f16acd5facf87ffe5738c44bbf2795.jpg" style="margin: 0; width: 100%;" alt="" />
<p style="font-size: 12px; margin: 0;">PikWizard</p>
</a>
</span>
</span>
Free (free of charge)
Free for personal and commercial use.
Author: Awesome Content
Similar Free Stock Images

Premium

Premium

Premium


Premium

Premium


Premium


Premium


Premium


Premium

Premium

Premium

Premium


Premium


Premium

Premium


Premium


Premium


Premium


Premium


Premium


Premium


Premium


Premium


Premium


Premium


Explore More Free Stock Images