- Home >
- Stock Photos >
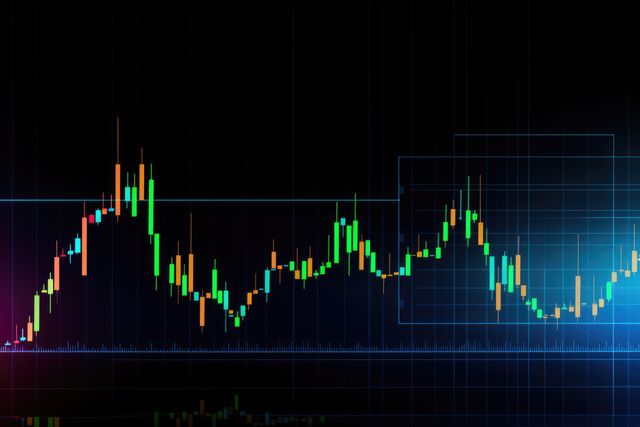
- Dynamic Candlestick and Histogram Chart for Financial Analytics
Dynamic Candlestick and Histogram Chart for Financial Analytics Image

Vibrant candlestick and histogram chart displaying financial data analysis against dark backdrop. Teal bars and detailed line graph highlight stock market trends, ideal for financial websites, analytics reports, and investment presentations emphasizing digital data and technology.
Powered by  - Get 15% off with code: PIKWIZARD15


downloads
Tags:
More
Credit Photo
If you would like to credit the Photo, here are some ways you can do so
Text Link
photo Link
<span class="text-link">
<span>
<a target="_blank" href=https://pikwizard.com/photo/dynamic-candlestick-and-histogram-chart-for-financial-analytics/c8be189a48e999c08f358330ec57bc6b/>PikWizard</a>
</span>
</span>
<span class="image-link">
<span
style="margin: 0 0 20px 0; display: inline-block; vertical-align: middle; width: 100%;"
>
<a
target="_blank"
href="https://pikwizard.com/photo/dynamic-candlestick-and-histogram-chart-for-financial-analytics/c8be189a48e999c08f358330ec57bc6b/"
style="text-decoration: none; font-size: 10px; margin: 0;"
>
<img src="https://pikwizard.com/pw/medium/c8be189a48e999c08f358330ec57bc6b.jpg" style="margin: 0; width: 100%;" alt="" />
<p style="font-size: 12px; margin: 0;">PikWizard</p>
</a>
</span>
</span>
Free (free of charge)
Free for personal and commercial use.
Author: Creative Art