
- Home >
- Stock Photos >
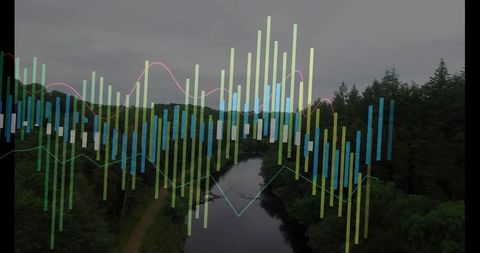
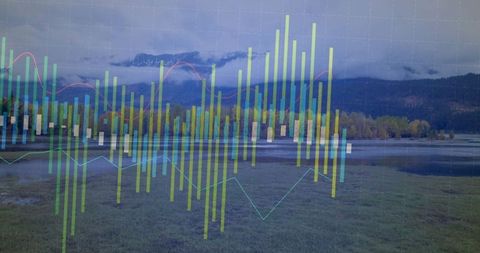
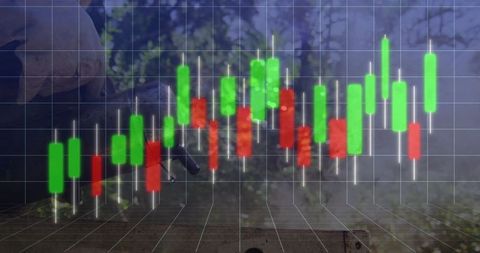
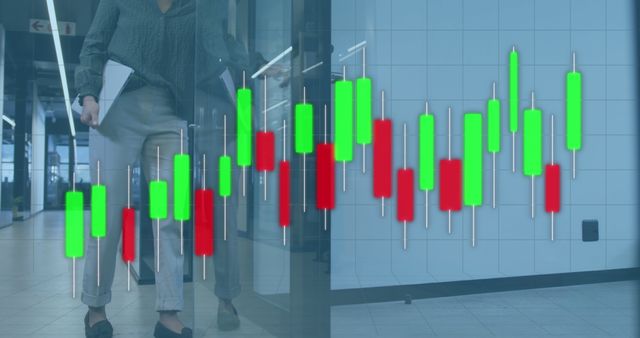
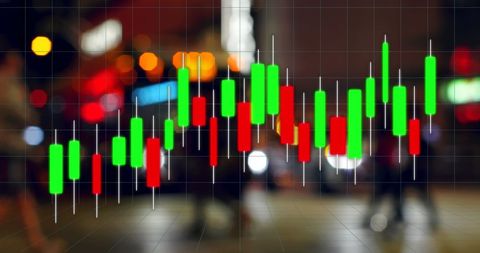
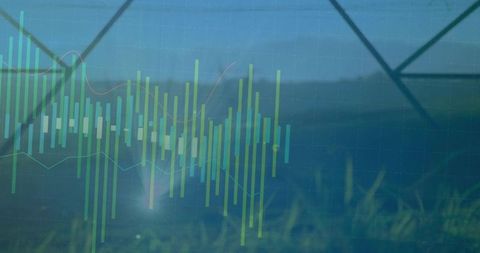
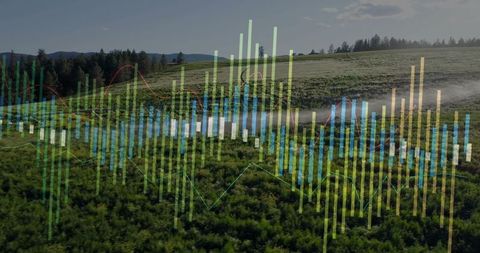
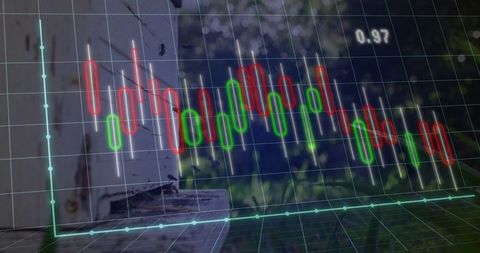
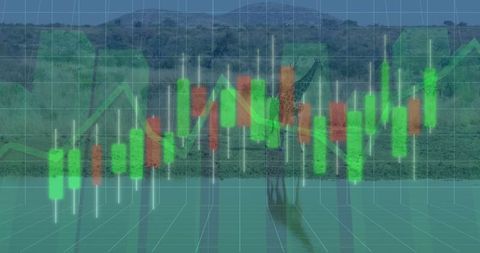
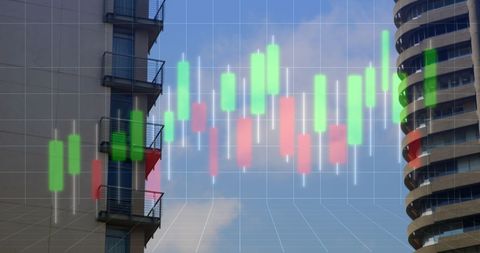
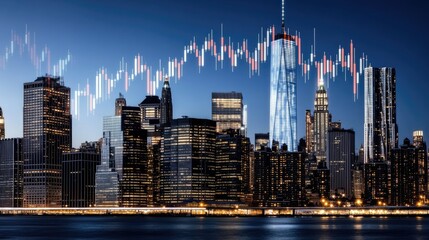
- Dynamic Candlestick Chart Overlaid on Translucent Forest Grid
Dynamic Candlestick Chart Overlaid on Translucent Forest Grid Image
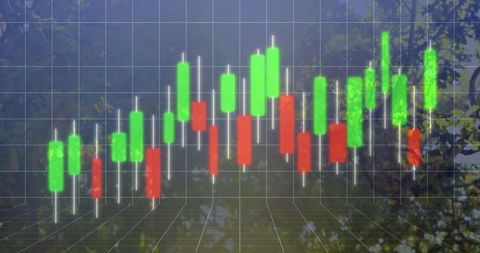
Candlestick chart featuring green and red bars displayed on transparent digital forest grid, perfect for financial market analysis visualization. Symbolizes intersection of natural and fintech world. Ideal for finance, market insights, trend analysis projects and technology articles.
Powered by 


downloads
Tags:
More
Credit Photo
If you would like to credit the Photo, here are some ways you can do so
Text Link
photo Link
<span class="text-link">
<span>
<a target="_blank" href=https://pikwizard.com/photo/dynamic-candlestick-chart-overlaid-on-translucent-forest-grid/dd236f8d2a7240520ea360707e37f3b2/>PikWizard</a>
</span>
</span>
<span class="image-link">
<span
style="margin: 0 0 20px 0; display: inline-block; vertical-align: middle; width: 100%;"
>
<a
target="_blank"
href="https://pikwizard.com/photo/dynamic-candlestick-chart-overlaid-on-translucent-forest-grid/dd236f8d2a7240520ea360707e37f3b2/"
style="text-decoration: none; font-size: 10px; margin: 0;"
>
<img src="https://pikwizard.com/pw/medium/dd236f8d2a7240520ea360707e37f3b2.jpg" style="margin: 0; width: 100%;" alt="" />
<p style="font-size: 12px; margin: 0;">PikWizard</p>
</a>
</span>
</span>
Free (free of charge)
Free for personal and commercial use.
Author: Awesome Content
Similar Free Stock Images

Premium


Premium


Premium


Premium


Premium

Premium


Premium


Premium

Premium

Premium


Premium


Premium


Premium

Premium


Premium


Premium


Premium

Premium


Premium


Premium

Premium

Premium

Premium


AI


Premium


Premium


Explore More Free Stock Images