
- Home >
- Stock Photos >
- Dynamic Candlestick Chart with Code and Trendline Elements
Dynamic Candlestick Chart with Code and Trendline Elements Image
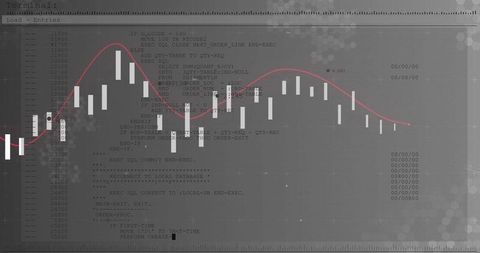
This visual features a candlestick chart with a pink trend line overlaying abstract SQL code within a grey digital terminal interface. Ideal for illustrating concepts in financial data analysis, algorithmic trading, or programming. The image highlights historical financial data depicted through stock chart bars, making it suitable for corporate reports, market analysis presentations, and financial technology blogs.
Powered by  - Get 15% off with code: PIKWIZARD15


downloads
Tags:
More
Credit Photo
If you would like to credit the Photo, here are some ways you can do so
Text Link
photo Link
<span class="text-link">
<span>
<a target="_blank" href=https://pikwizard.com/photo/dynamic-candlestick-chart-with-code-and-trendline-elements/f700fe7f27d045d4d6bbf129563e2162/>PikWizard</a>
</span>
</span>
<span class="image-link">
<span
style="margin: 0 0 20px 0; display: inline-block; vertical-align: middle; width: 100%;"
>
<a
target="_blank"
href="https://pikwizard.com/photo/dynamic-candlestick-chart-with-code-and-trendline-elements/f700fe7f27d045d4d6bbf129563e2162/"
style="text-decoration: none; font-size: 10px; margin: 0;"
>
<img src="https://pikwizard.com/pw/medium/f700fe7f27d045d4d6bbf129563e2162.jpg" style="margin: 0; width: 100%;" alt="" />
<p style="font-size: 12px; margin: 0;">PikWizard</p>
</a>
</span>
</span>
Free (free of charge)
Free for personal and commercial use.
Author: Awesome Content