- Home >
- Stock Photos >
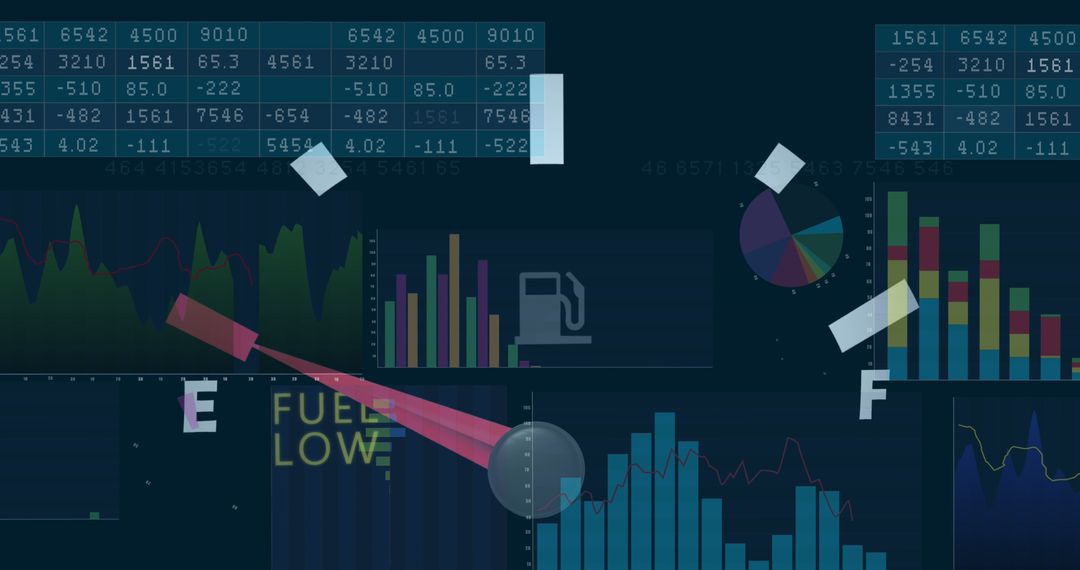
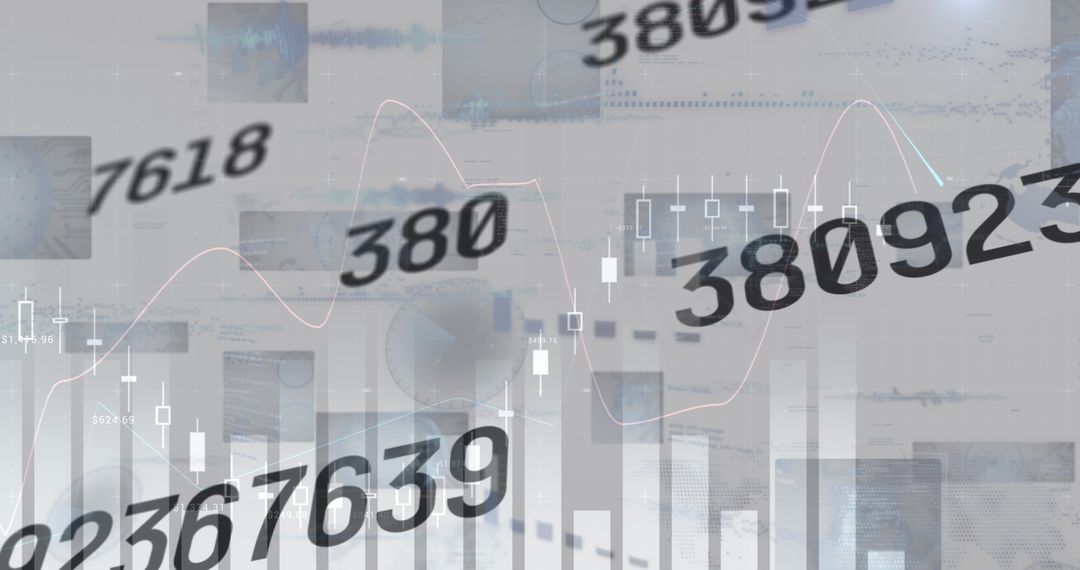
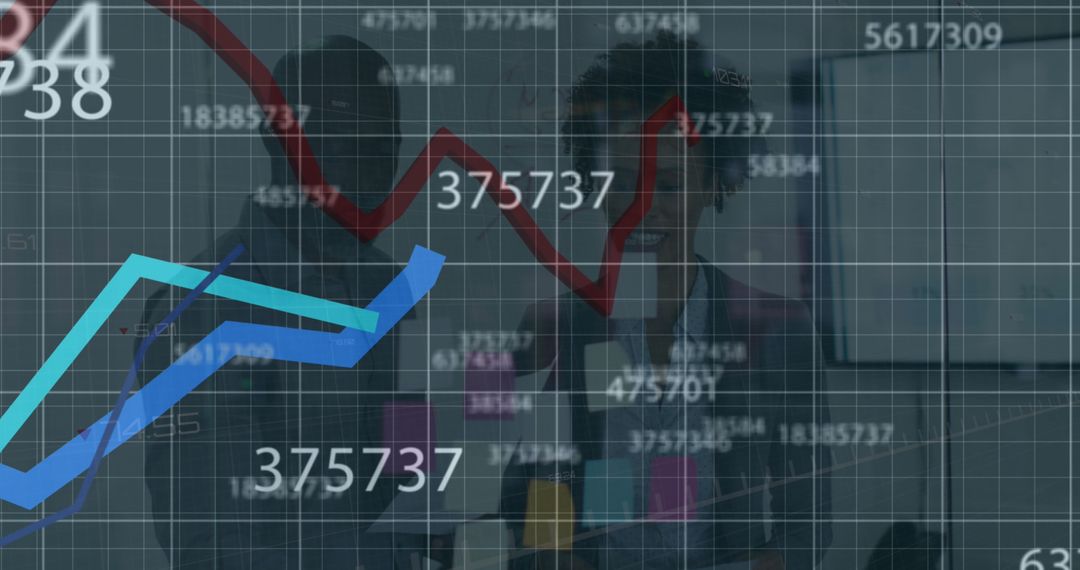
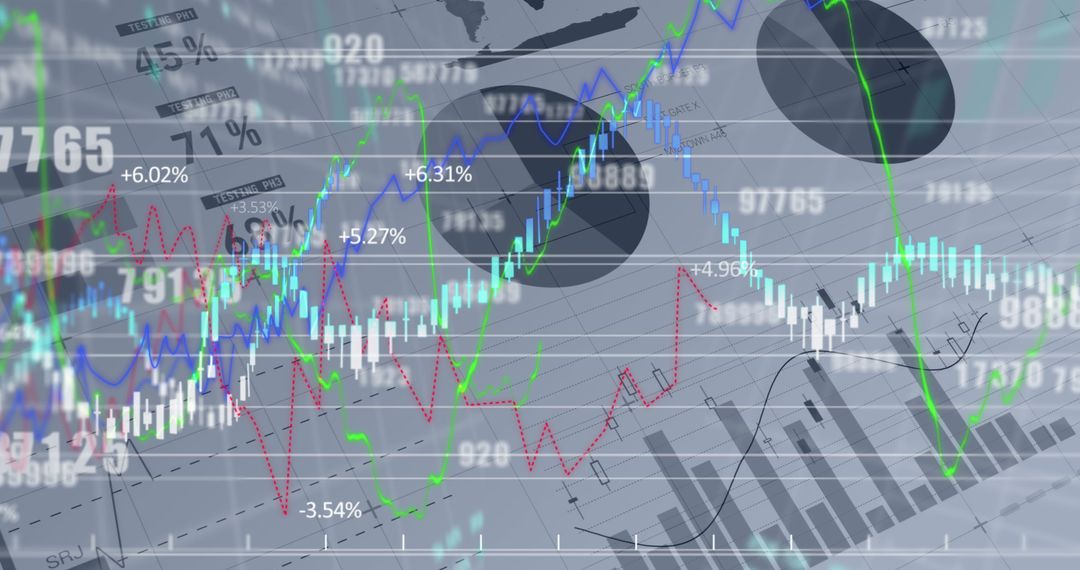
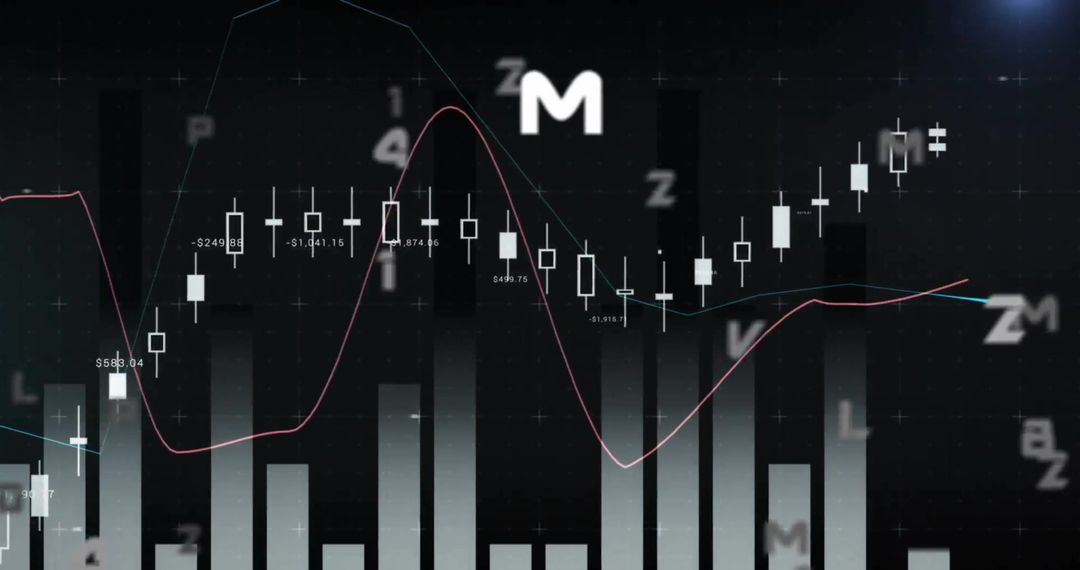
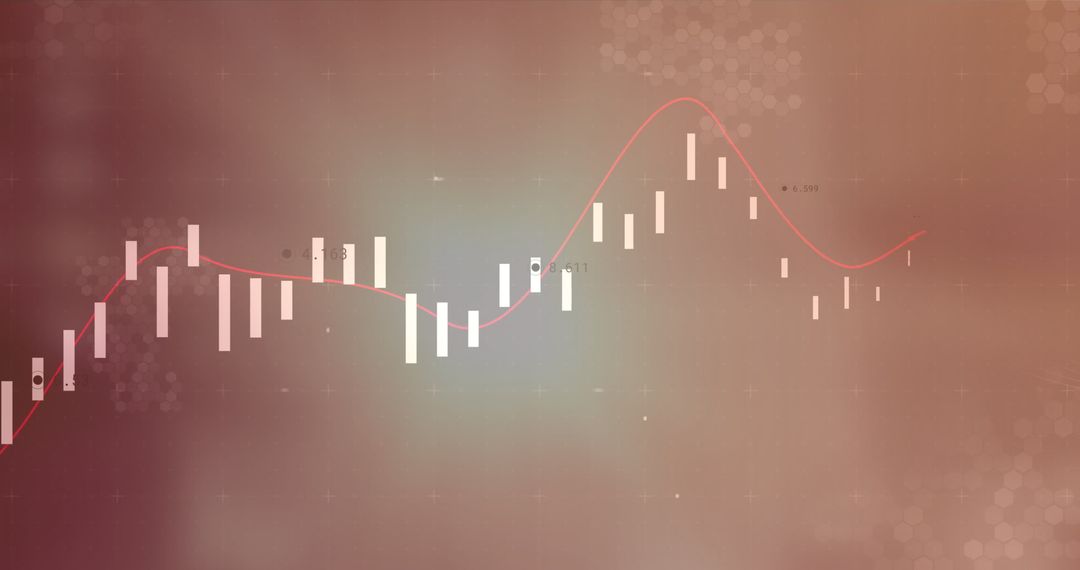
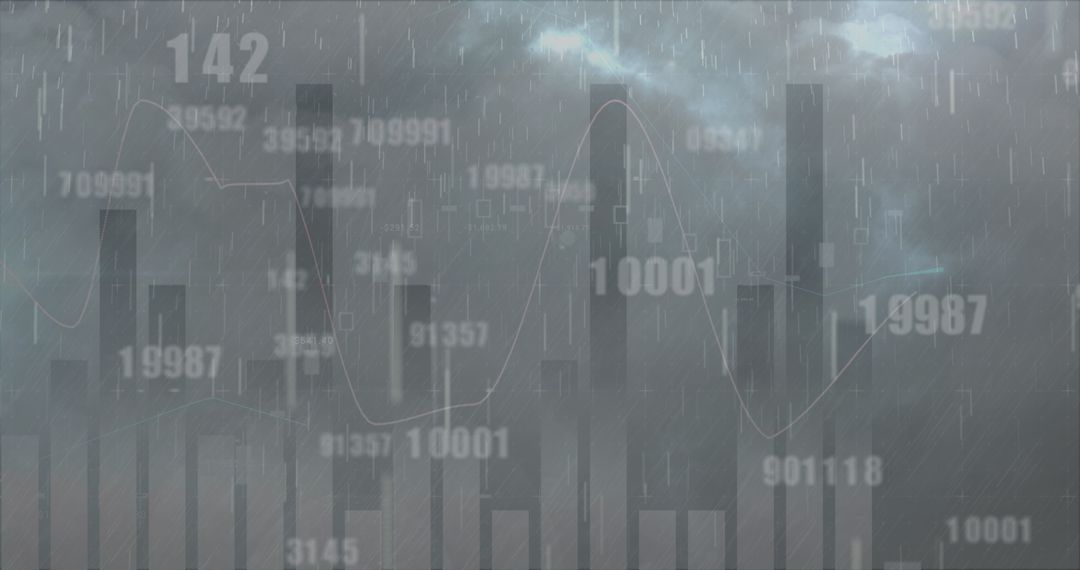
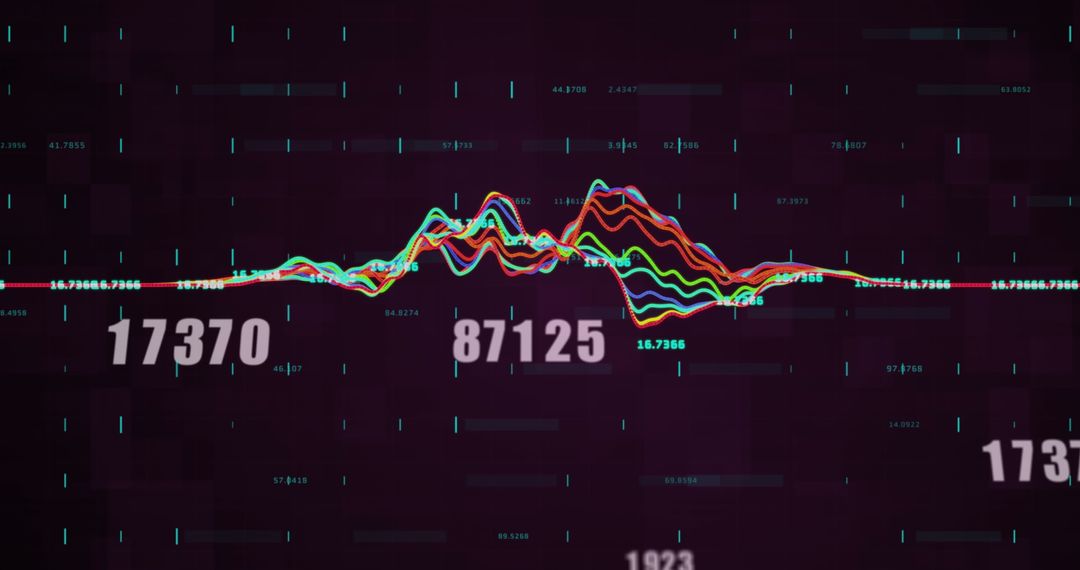
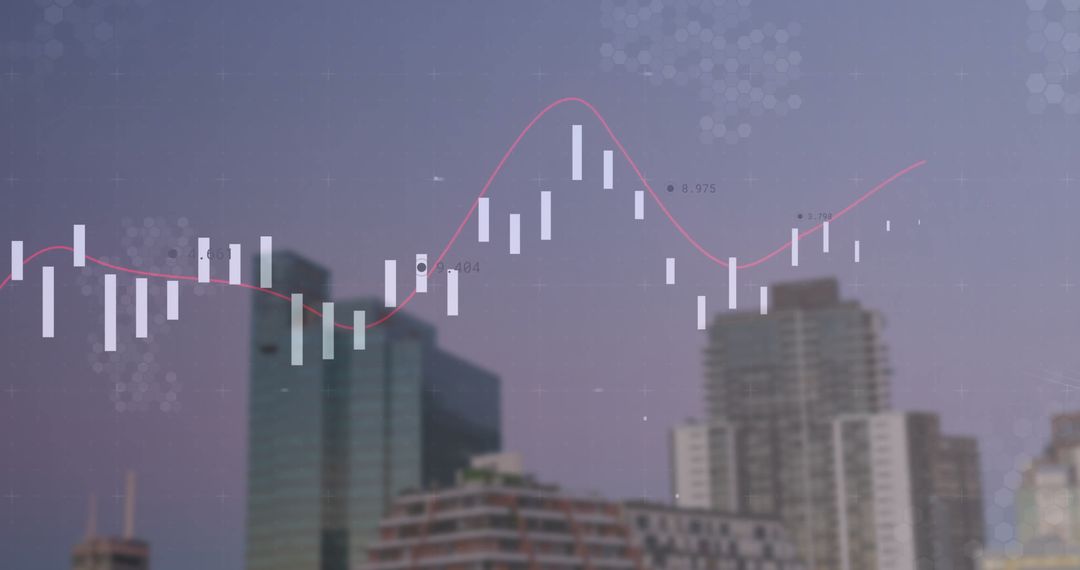
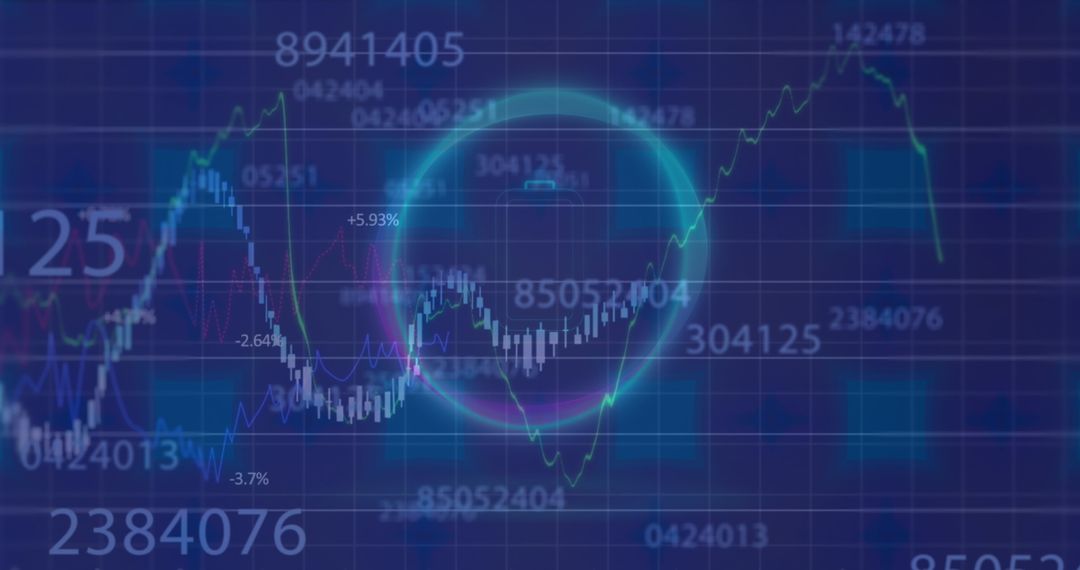
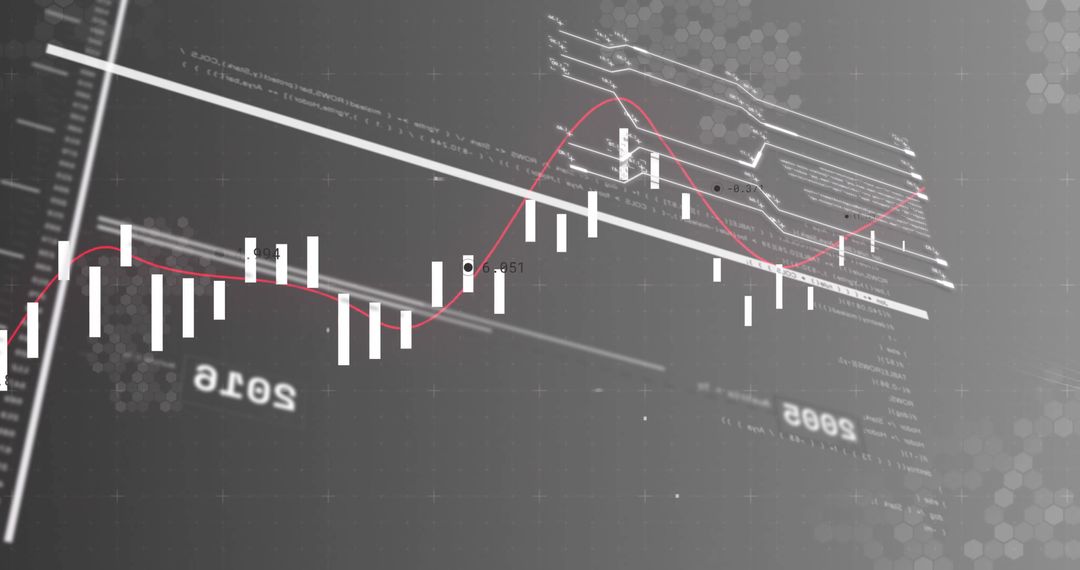
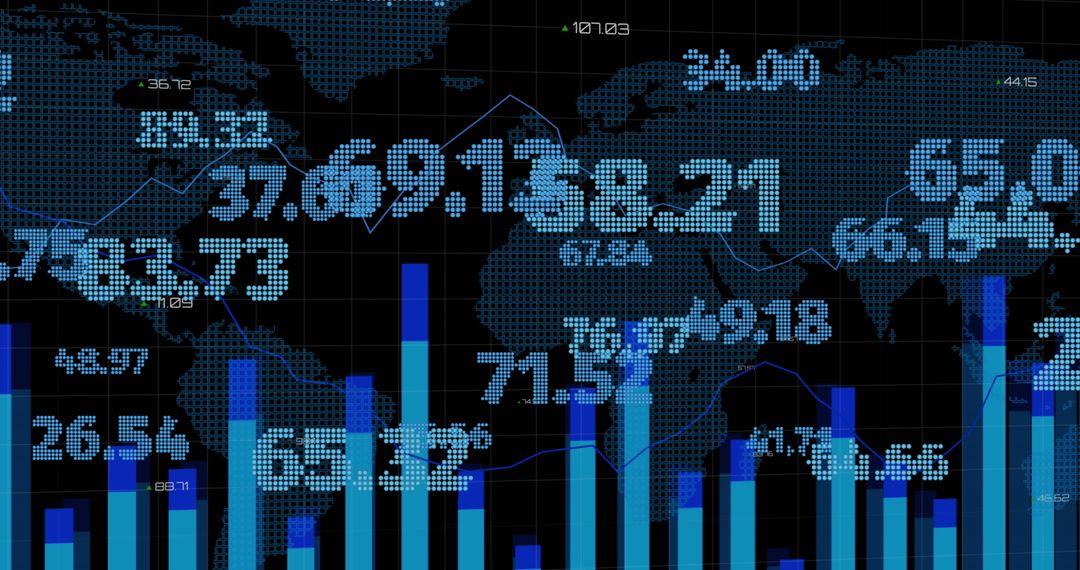
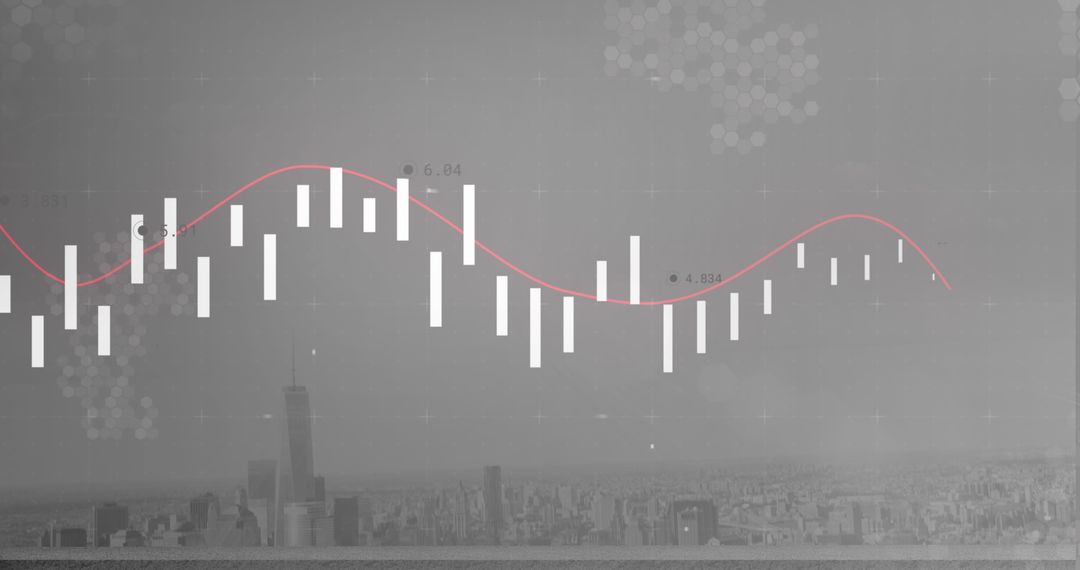
- Dynamic Candlestick Chart with Trend Line and Financial Data Visuals
Dynamic Candlestick Chart with Trend Line and Financial Data Visuals Image
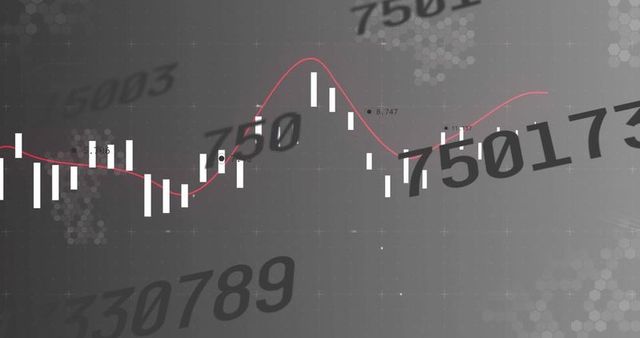
Visual illustration of a dynamic candlestick chart with a precise trend line, aiding in financial analysis and understanding market trends. Numbers float across the visual, enhancing the representation of trading technology and offering crucial insights for investors and analysts. Suitable for presentations, financial reports, and investment strategy discussions.
Powered by  - Get 15% off with code: PIKWIZARD15


0
downloads
downloads
Tags:
More
Credit Photo
If you would like to credit the Photo, here are some ways you can do so
Text Link
photo Link
<span class="text-link">
<span>
<a target="_blank" href=https://pikwizard.com/photo/dynamic-candlestick-chart-with-trend-line-and-financial-data-visuals/fa1f3238751a2ace9265e1c014a3179e/>PikWizard</a>
</span>
</span>
<span class="image-link">
<span
style="margin: 0 0 20px 0; display: inline-block; vertical-align: middle; width: 100%;"
>
<a
target="_blank"
href="https://pikwizard.com/photo/dynamic-candlestick-chart-with-trend-line-and-financial-data-visuals/fa1f3238751a2ace9265e1c014a3179e/"
style="text-decoration: none; font-size: 10px; margin: 0;"
>
<img src="https://pikwizard.com/pw/medium/fa1f3238751a2ace9265e1c014a3179e.jpg" style="margin: 0; width: 100%;" alt="" />
<p style="font-size: 12px; margin: 0;">PikWizard</p>
</a>
</span>
</span>
Free (free of charge)
Free for personal and commercial use.
Author: Creative Art
Similar Free Stock Images

Premium

Premium


Premium


Premium


Premium


Premium


Premium


Premium


Premium


Premium


Premium


Premium


Premium


Premium


Premium


Premium


Premium


Premium


Premium


Premium


Premium


Premium


Premium


Premium