- Home >
- Stock Photos >
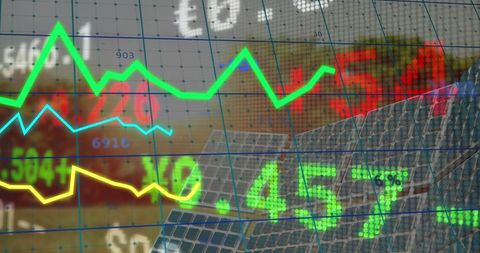
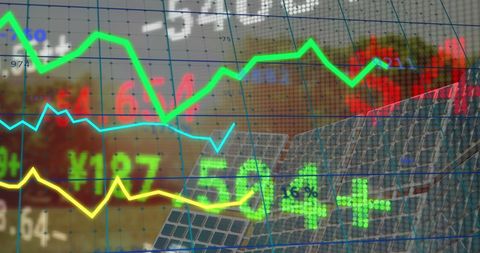
- Dynamic Candlestick Graph with Data Lines and Figures for Analytics
Dynamic Candlestick Graph with Data Lines and Figures for Analytics Image

Visual display emphasizes the dynamic nature of financial markets through candlestick graph with electric blue, green, and magenta lines. Useful for presentations, financial reports, or educational materials dealing with stock market analysis or investment strategies. Effective for demonstrating trends, projections, or historic price fluctuations in a professional context.
Powered by 


downloads
Tags:
More
Credit Photo
If you would like to credit the Photo, here are some ways you can do so
Text Link
photo Link
<span class="text-link">
<span>
<a target="_blank" href=https://pikwizard.com/photo/dynamic-candlestick-graph-with-data-lines-and-figures-for-analytics/1b38effbe49baa5551cc82ed83620b7f/>PikWizard</a>
</span>
</span>
<span class="image-link">
<span
style="margin: 0 0 20px 0; display: inline-block; vertical-align: middle; width: 100%;"
>
<a
target="_blank"
href="https://pikwizard.com/photo/dynamic-candlestick-graph-with-data-lines-and-figures-for-analytics/1b38effbe49baa5551cc82ed83620b7f/"
style="text-decoration: none; font-size: 10px; margin: 0;"
>
<img src="https://pikwizard.com/pw/medium/1b38effbe49baa5551cc82ed83620b7f.jpg" style="margin: 0; width: 100%;" alt="" />
<p style="font-size: 12px; margin: 0;">PikWizard</p>
</a>
</span>
</span>
Free (free of charge)
Free for personal and commercial use.
Author: Authentic Images