- Home >
- Stock Photos >
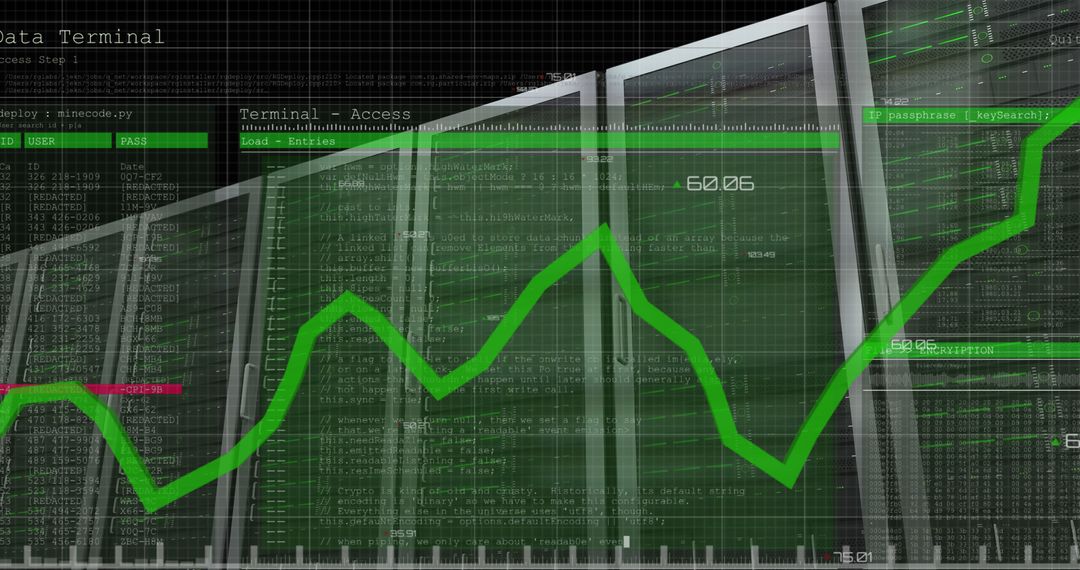
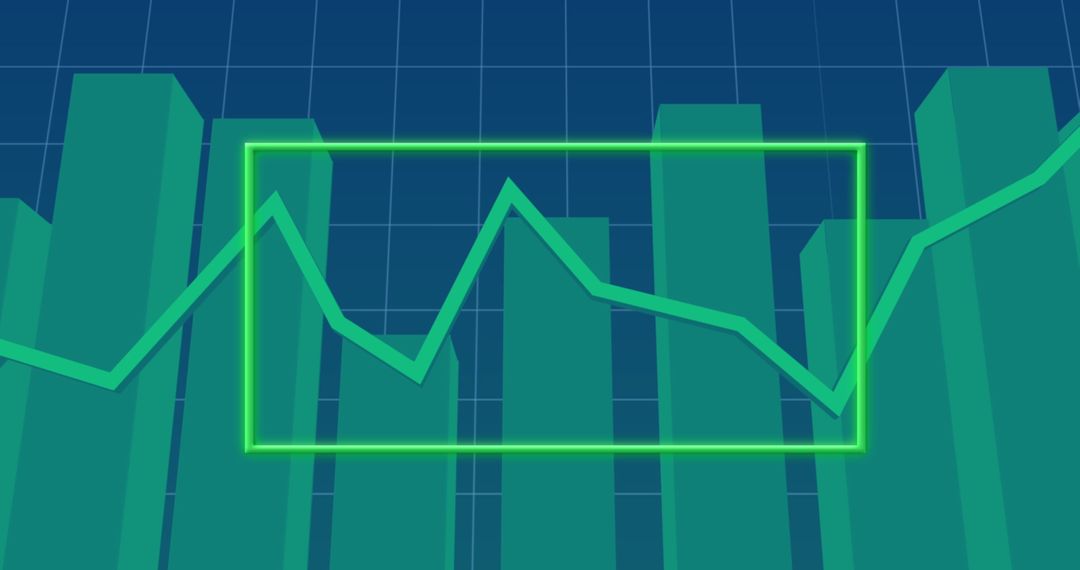
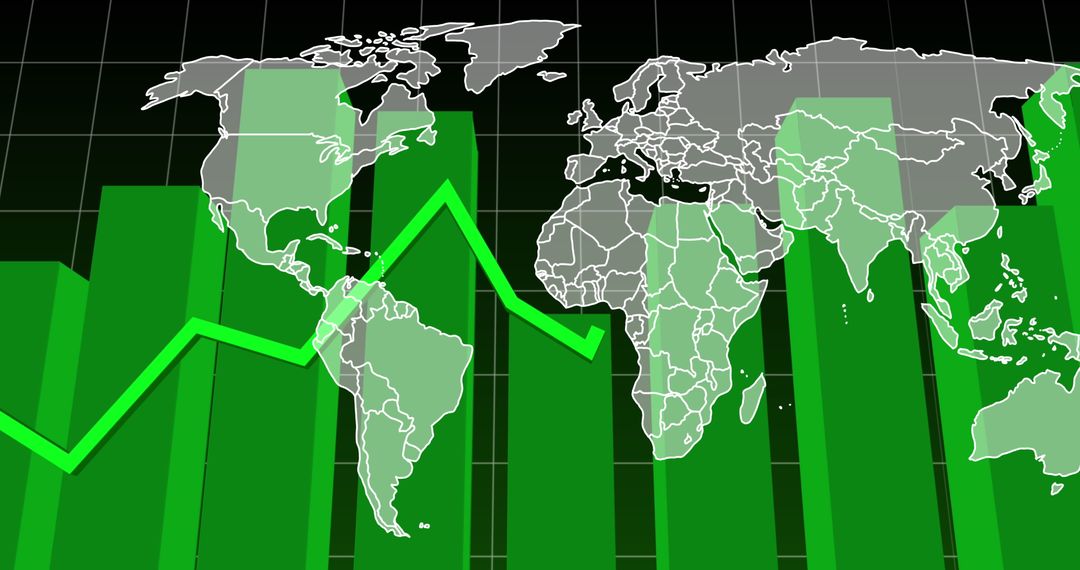
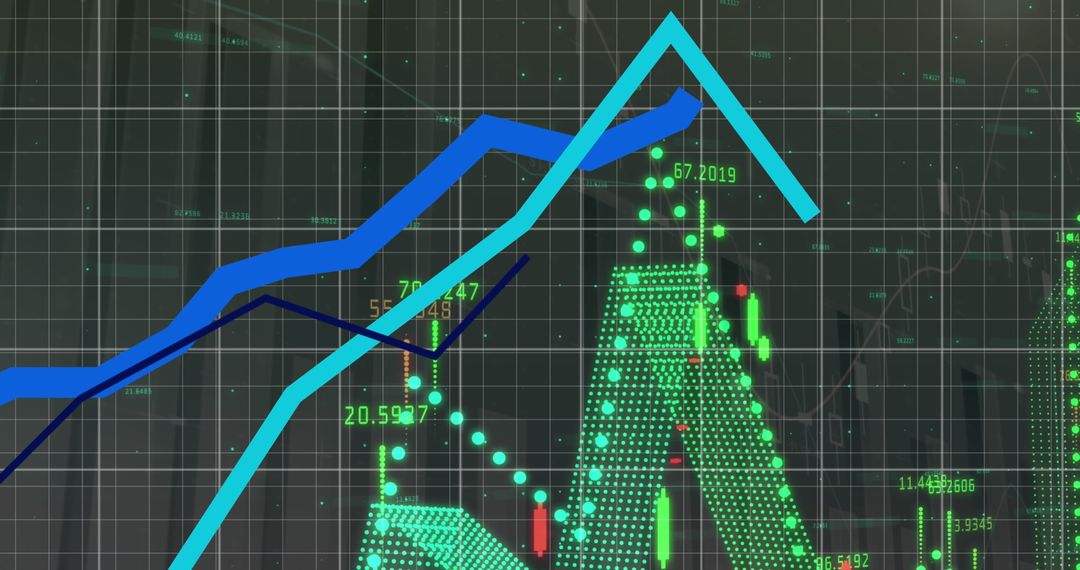
- Dynamic Chart with Green Bar Graph and Growing Trendline
Dynamic Chart with Green Bar Graph and Growing Trendline Image

Image depicts green bar graph displaying growth trajectory with a prominent trendline. Digital enhancements and global connections emphasize data analytics importance. Ideal for presentations on economic growth, data processing, and business analysis. Suitable for websites, reports, and teaching materials related to statistics or economics.
Powered by  - Get 15% off with code: PIKWIZARD15


0
downloads
downloads
Tags:
More
Credit Photo
If you would like to credit the Photo, here are some ways you can do so
Text Link
photo Link
<span class="text-link">
<span>
<a target="_blank" href=https://pikwizard.com/photo/dynamic-chart-with-green-bar-graph-and-growing-trendline/dc258f1b1c5321bb0ac4b66a7ac18893/>PikWizard</a>
</span>
</span>
<span class="image-link">
<span
style="margin: 0 0 20px 0; display: inline-block; vertical-align: middle; width: 100%;"
>
<a
target="_blank"
href="https://pikwizard.com/photo/dynamic-chart-with-green-bar-graph-and-growing-trendline/dc258f1b1c5321bb0ac4b66a7ac18893/"
style="text-decoration: none; font-size: 10px; margin: 0;"
>
<img src="https://pikwizard.com/pw/medium/dc258f1b1c5321bb0ac4b66a7ac18893.jpg" style="margin: 0; width: 100%;" alt="" />
<p style="font-size: 12px; margin: 0;">PikWizard</p>
</a>
</span>
</span>
Free (free of charge)
Free for personal and commercial use.
Author: People Creations
Similar Free Stock Images

Premium


Premium


Premium


Premium


Premium


Premium


Premium


Premium


Premium


Premium


Premium


Premium


Premium


Premium


Premium


Premium


Premium


Premium


Premium


Premium


Premium


Premium


Premium


Premium