
- Home >
- Stock Photos >
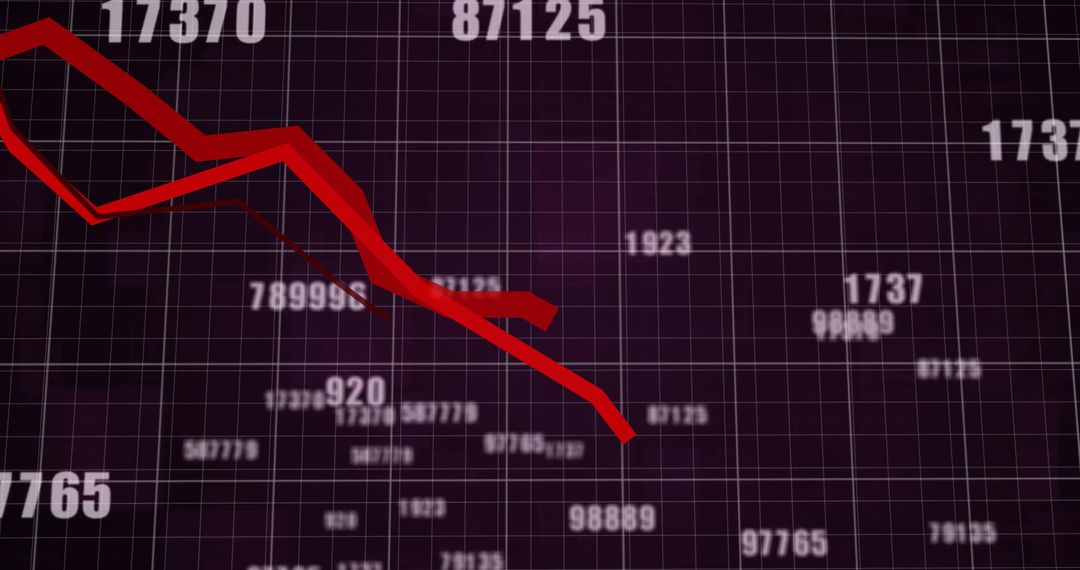
- Dynamic Charts and Lines Displaying Financial Data Trends
Dynamic Charts and Lines Displaying Financial Data Trends Image

Image showing an interwoven web of charts and dynamic lines representing financial data trends. Useful for visual content related to business growth, analytics, statistics, financial technology, and data processing themes in reports, websites, and presentations.
Powered by  - Get 15% off with code: PIKWIZARD15


2
downloads
downloads
Tags:
More
Credit Photo
If you would like to credit the Photo, here are some ways you can do so
Text Link
photo Link
<span class="text-link">
<span>
<a target="_blank" href=https://pikwizard.com/photo/dynamic-charts-and-lines-displaying-financial-data-trends/b55fecce5e771dc70f3e84afaa6ddddd/>PikWizard</a>
</span>
</span>
<span class="image-link">
<span
style="margin: 0 0 20px 0; display: inline-block; vertical-align: middle; width: 100%;"
>
<a
target="_blank"
href="https://pikwizard.com/photo/dynamic-charts-and-lines-displaying-financial-data-trends/b55fecce5e771dc70f3e84afaa6ddddd/"
style="text-decoration: none; font-size: 10px; margin: 0;"
>
<img src="https://pikwizard.com/pw/medium/b55fecce5e771dc70f3e84afaa6ddddd.jpg" style="margin: 0; width: 100%;" alt="" />
<p style="font-size: 12px; margin: 0;">PikWizard</p>
</a>
</span>
</span>
Free (free of charge)
Free for personal and commercial use.
Author: Awesome Content
Similar Free Stock Images

Premium


Premium


Premium


Premium


Premium


Premium


Premium


Premium


Premium


Premium


Premium


Premium


Premium


Premium


Premium


Premium


Premium


Premium


Premium


Premium


Premium


Premium


Premium


Premium

