
- Home >
- Stock Photos >
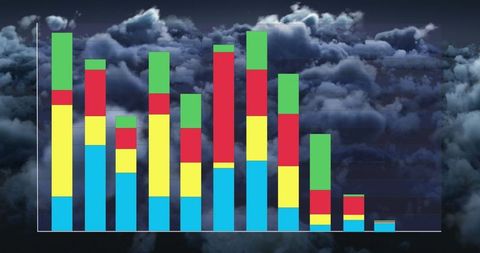
- Dynamic Colored Bar Graph with Digital Data Background
Dynamic Colored Bar Graph with Digital Data Background Image
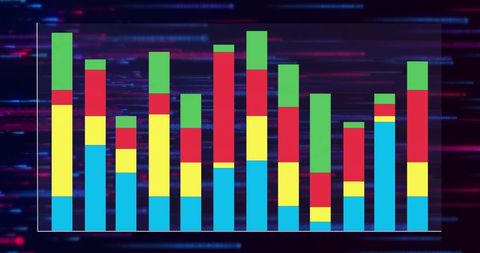
This vibrant visualization features colored vertical bar graphs superimposed over a blue and red digital data background, ideal for use in presentations about data analytics, business intelligence, infographics, and technology-driven studies. Useful in conveying statistics, analysis data, or as a visual aid for educational purposes.
Powered by  - Get 15% off with code: PIKWIZARD15


downloads
Tags:
More
Credit Photo
If you would like to credit the Photo, here are some ways you can do so
Text Link
photo Link
<span class="text-link">
<span>
<a target="_blank" href=https://pikwizard.com/photo/dynamic-colored-bar-graph-with-digital-data-background/e490ee3cde4e4d4dc131a7facedaf368/>PikWizard</a>
</span>
</span>
<span class="image-link">
<span
style="margin: 0 0 20px 0; display: inline-block; vertical-align: middle; width: 100%;"
>
<a
target="_blank"
href="https://pikwizard.com/photo/dynamic-colored-bar-graph-with-digital-data-background/e490ee3cde4e4d4dc131a7facedaf368/"
style="text-decoration: none; font-size: 10px; margin: 0;"
>
<img src="https://pikwizard.com/pw/medium/e490ee3cde4e4d4dc131a7facedaf368.jpg" style="margin: 0; width: 100%;" alt="" />
<p style="font-size: 12px; margin: 0;">PikWizard</p>
</a>
</span>
</span>
Free (free of charge)
Free for personal and commercial use.
Author: Awesome Content
Similar Free Stock Images

Premium


Premium


Premium


Premium


Premium

Premium


Premium


Premium


Premium


Premium


Premium

Premium

Premium


Premium


Premium

Premium


Premium


Premium


Premium


Premium


Premium

Premium


Premium


Premium


Premium


Explore More Free Stock Images