
- Home >
- Stock Photos >
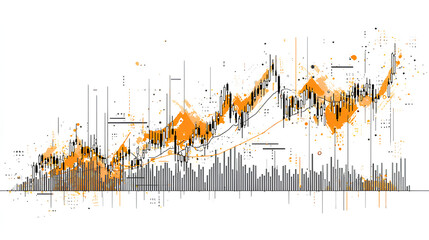
- Dynamic Colorful Data Visualization with Grid and Metrics
Dynamic Colorful Data Visualization with Grid and Metrics Image

Graphic depicting vibrant colors over technical grid featuring numbers 6539, showcasing visualization of data analytics. Useful for illustrating trends, analytical reports, or illustrating information in business presentations, informative pamphlets, or website design.
Powered by 


downloads
Tags:
More
Credit Photo
If you would like to credit the Photo, here are some ways you can do so
Text Link
photo Link
<span class="text-link">
<span>
<a target="_blank" href=https://pikwizard.com/photo/dynamic-colorful-data-visualization-with-grid-and-metrics/8086b4ffd7e3911e77e49c63b3f5d8af/>PikWizard</a>
</span>
</span>
<span class="image-link">
<span
style="margin: 0 0 20px 0; display: inline-block; vertical-align: middle; width: 100%;"
>
<a
target="_blank"
href="https://pikwizard.com/photo/dynamic-colorful-data-visualization-with-grid-and-metrics/8086b4ffd7e3911e77e49c63b3f5d8af/"
style="text-decoration: none; font-size: 10px; margin: 0;"
>
<img src="https://pikwizard.com/pw/medium/8086b4ffd7e3911e77e49c63b3f5d8af.jpg" style="margin: 0; width: 100%;" alt="" />
<p style="font-size: 12px; margin: 0;">PikWizard</p>
</a>
</span>
</span>
Free (free of charge)
Free for personal and commercial use.
Author: Creative Art
Similar Free Stock Images

Premium

Premium


Premium


Premium


Premium


Premium


Premium


Premium


Premium


Premium


Premium


Premium


Premium


Premium


Premium


Premium

Premium

Premium


Premium


Premium


Premium

Premium


Premium


Premium


Premium


Explore More Free Stock Images