
- Home >
- Stock Photos >
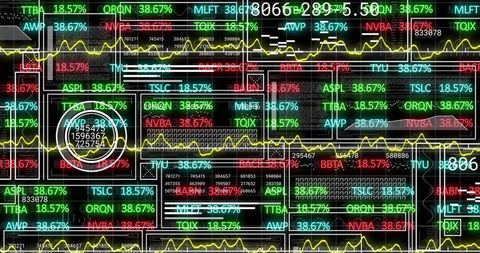
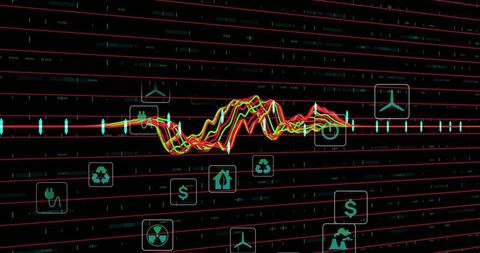
- Dynamic Cybersecurity Data Visualization Interface Screen
Dynamic Cybersecurity Data Visualization Interface Screen Image
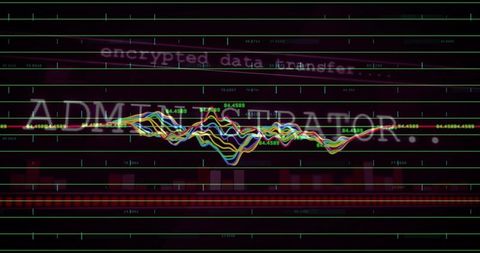
This image shows a digital interface with vibrant waveform oscillation on a red grid background, combined with glitching text and data labels. It is ideal for illustrating digital security concepts like encrypted data transfer and technical interfaces. Suitable for technology presentations, IT security content, and articles on advanced data visualizations in the tech industry.
Powered by  - Get 15% off with code: PIKWIZARD15


downloads
Tags:
More
Credit Photo
If you would like to credit the Photo, here are some ways you can do so
Text Link
photo Link
<span class="text-link">
<span>
<a target="_blank" href=https://pikwizard.com/photo/dynamic-cybersecurity-data-visualization-interface-screen/97163e16b8953ba02992abcb60577536/>PikWizard</a>
</span>
</span>
<span class="image-link">
<span
style="margin: 0 0 20px 0; display: inline-block; vertical-align: middle; width: 100%;"
>
<a
target="_blank"
href="https://pikwizard.com/photo/dynamic-cybersecurity-data-visualization-interface-screen/97163e16b8953ba02992abcb60577536/"
style="text-decoration: none; font-size: 10px; margin: 0;"
>
<img src="https://pikwizard.com/pw/medium/97163e16b8953ba02992abcb60577536.jpg" style="margin: 0; width: 100%;" alt="" />
<p style="font-size: 12px; margin: 0;">PikWizard</p>
</a>
</span>
</span>
Free (free of charge)
Free for personal and commercial use.
Author: People Creations
Similar Free Stock Images

Premium


Premium

Premium

Premium


Premium


Premium


Premium

Premium


Premium

Premium

Premium

Premium

Premium
Premium

Premium


Premium

Premium

Premium


Premium


Premium


Premium


Premium

Premium


Premium


Premium


Explore More Free Stock Images