
- Home >
- Stock Photos >
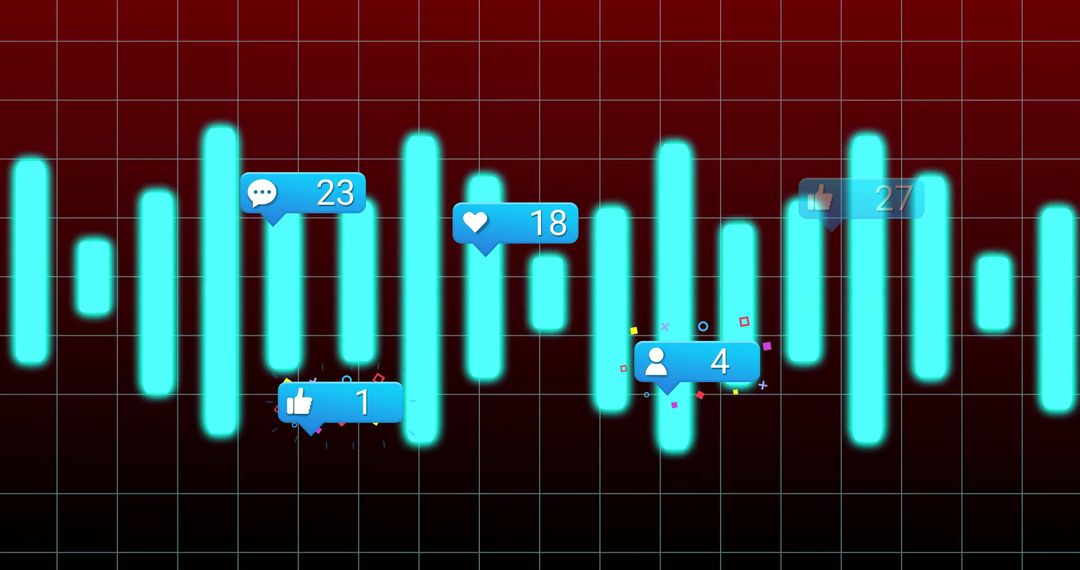
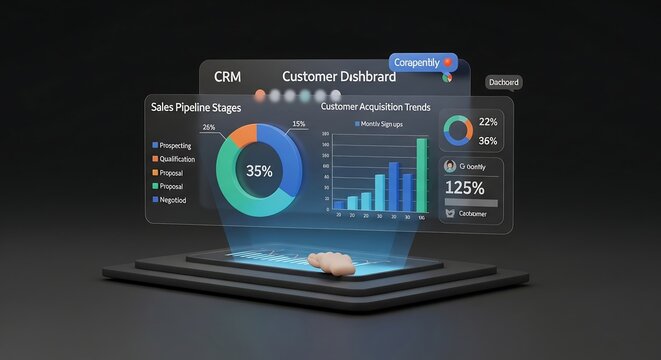
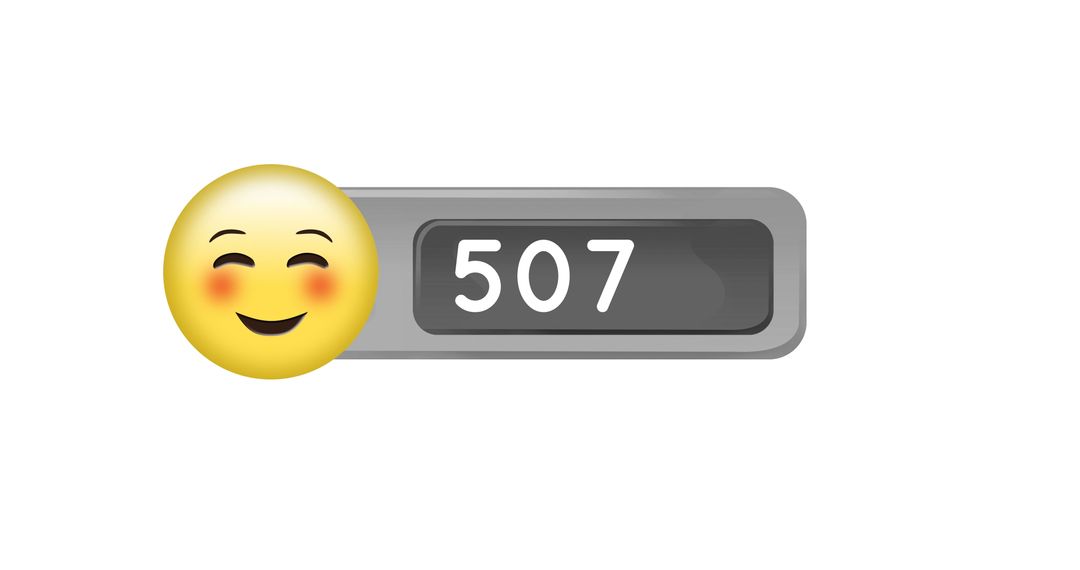
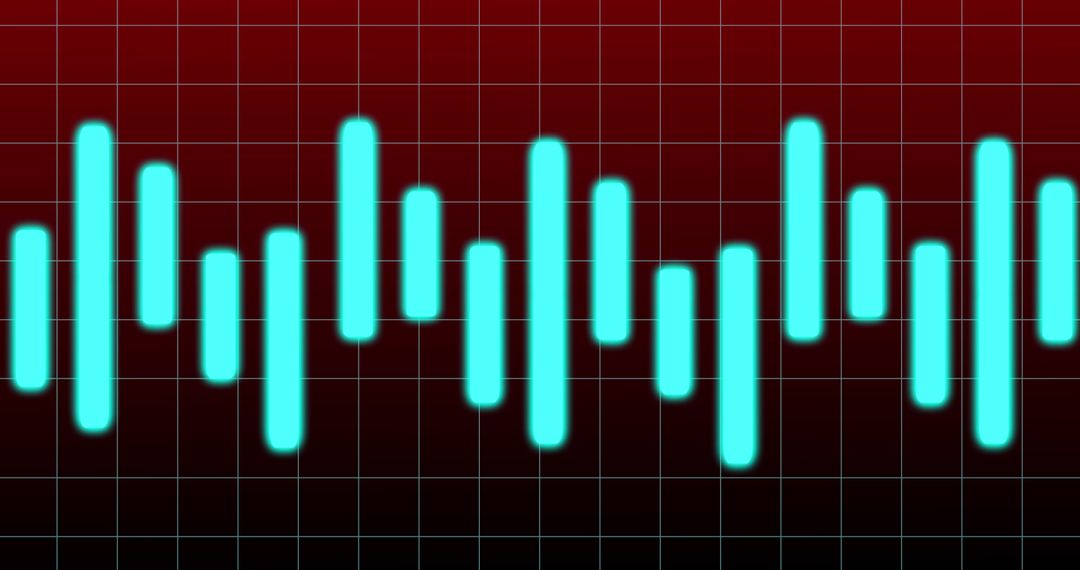
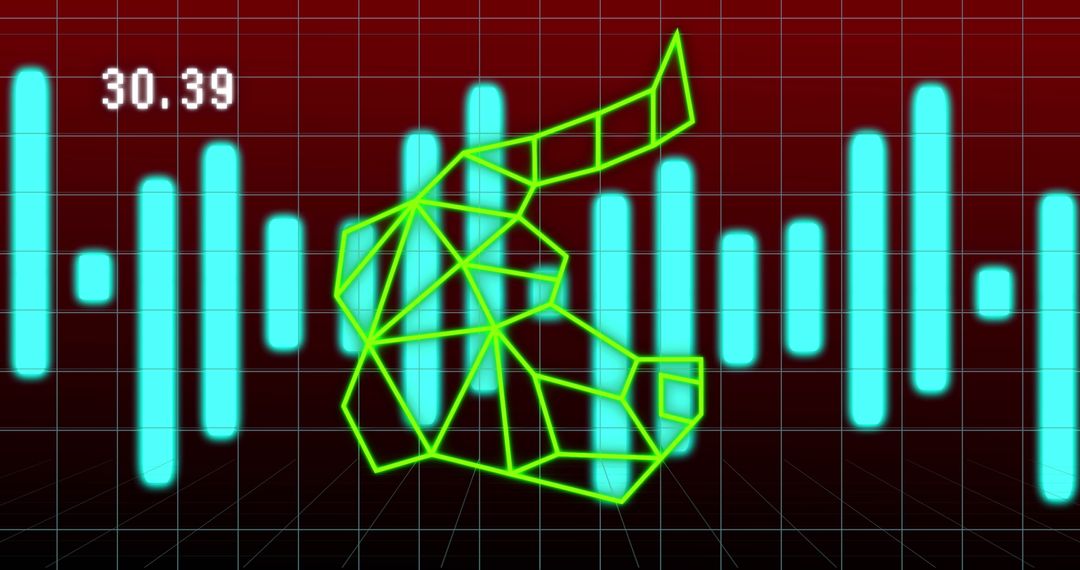
- Dynamic Dashboard with Cyan Bars and Chat Notifications
Dynamic Dashboard with Cyan Bars and Chat Notifications Image

Visual representation emphasizes concepts of data tracking, real-time updates, and digital communication trend. Suitable for illustrating technology blogs, data analysis platforms, or digital communication tools. Useful for presentations or marketing material related to online networks or user interaction monitoring.
Powered by 


0
downloads
downloads
Tags:
More
Credit Photo
If you would like to credit the Photo, here are some ways you can do so
Text Link
photo Link
<span class="text-link">
<span>
<a target="_blank" href=https://pikwizard.com/photo/dynamic-dashboard-with-cyan-bars-and-chat-notifications/7ef0a3bcab414c251942b7c220678003/>PikWizard</a>
</span>
</span>
<span class="image-link">
<span
style="margin: 0 0 20px 0; display: inline-block; vertical-align: middle; width: 100%;"
>
<a
target="_blank"
href="https://pikwizard.com/photo/dynamic-dashboard-with-cyan-bars-and-chat-notifications/7ef0a3bcab414c251942b7c220678003/"
style="text-decoration: none; font-size: 10px; margin: 0;"
>
<img src="https://pikwizard.com/pw/medium/7ef0a3bcab414c251942b7c220678003.jpg" style="margin: 0; width: 100%;" alt="" />
<p style="font-size: 12px; margin: 0;">PikWizard</p>
</a>
</span>
</span>
Free (free of charge)
Free for personal and commercial use.
Author: Authentic Images
Similar Free Stock Images

Premium


Premium


Premium


Premium


Premium


Premium


Premium


Premium


Premium


Premium


Premium


Premium


Premium


Premium


Premium


Premium


Premium


Premium


Premium


Premium


Premium


Premium


Premium


Premium

