
- Home >
- Stock Photos >
- Dynamic Dashboard with Green Graphs for Data Analytics
Dynamic Dashboard with Green Graphs for Data Analytics Image
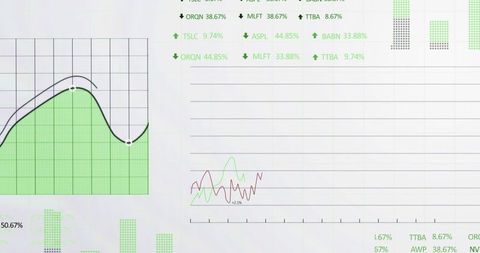
Visual representation showcases graph and chart details, useful for presentations on analytics or reports. Bright green elements denote trends and performance, ideal for illustrating data insights and transformations effectively.
Powered by 


downloads
Tags:
More
Credit Photo
If you would like to credit the Photo, here are some ways you can do so
Text Link
photo Link
<span class="text-link">
<span>
<a target="_blank" href=https://pikwizard.com/photo/dynamic-dashboard-with-green-graphs-for-data-analytics/6bc8f6a0099b676fdd62e8671c846793/>PikWizard</a>
</span>
</span>
<span class="image-link">
<span
style="margin: 0 0 20px 0; display: inline-block; vertical-align: middle; width: 100%;"
>
<a
target="_blank"
href="https://pikwizard.com/photo/dynamic-dashboard-with-green-graphs-for-data-analytics/6bc8f6a0099b676fdd62e8671c846793/"
style="text-decoration: none; font-size: 10px; margin: 0;"
>
<img src="https://pikwizard.com/pw/medium/6bc8f6a0099b676fdd62e8671c846793.jpg" style="margin: 0; width: 100%;" alt="" />
<p style="font-size: 12px; margin: 0;">PikWizard</p>
</a>
</span>
</span>
Free (free of charge)
Free for personal and commercial use.
Author: People Creations