- Home >
- Stock Photos >
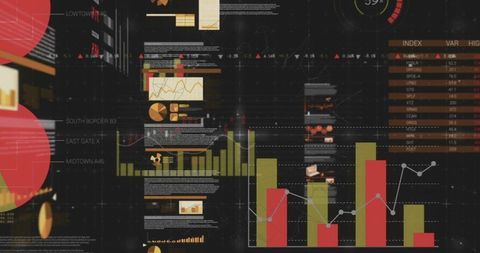
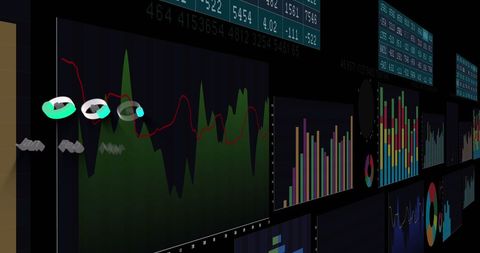
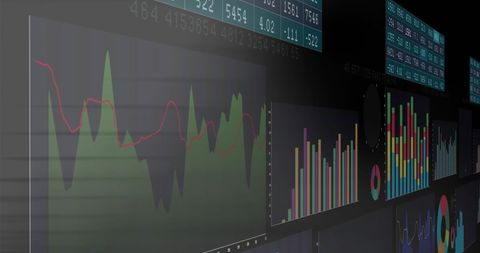
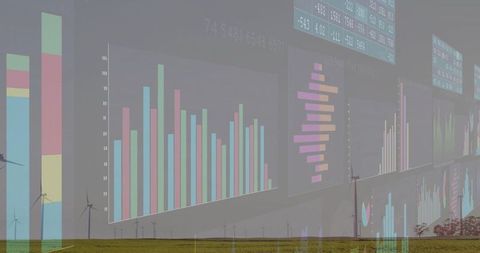
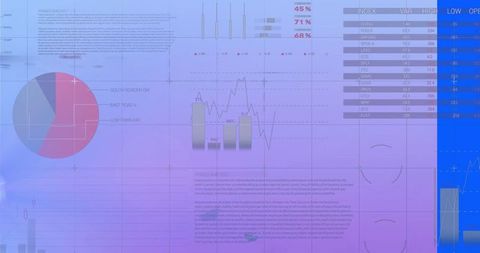
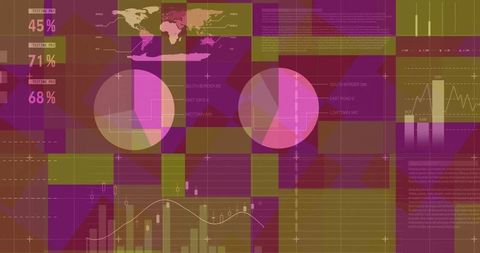
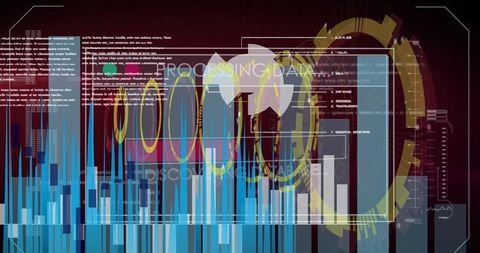
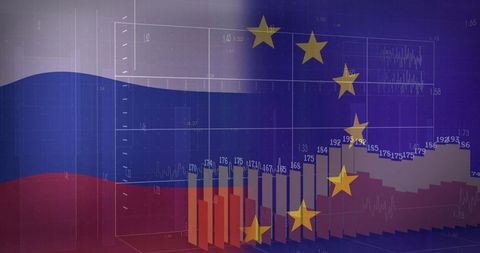
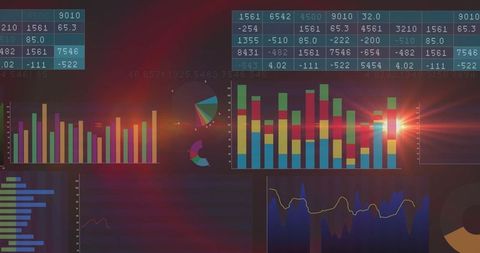
- Dynamic Dashboard with Real-Time Data Visualization Elements
Dynamic Dashboard with Real-Time Data Visualization Elements Image
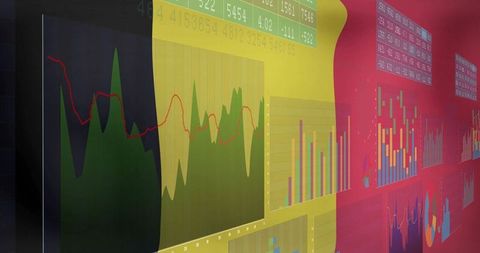
Engaging composition focusing on dynamic data visualization elements such as area charts, trend line, bar and pie charts, supporting numeric readouts representing complex variables. This imagery showcases cutting-edge technology for professionals looking for insightful analysis and monitoring solutions. Ideal for use in presentations, financial reports, or online share for tech and financial industry stakeholders focusing on real-time data analysis, providing clear communication for clients and teams interested in utilizing modern technology in business operations.

downloads
Tags:
More
Credit Photo
If you would like to credit the Photo, here are some ways you can do so
Text Link
photo Link
<span class="text-link">
<span>
<a target="_blank" href=https://pikwizard.com/photo/dynamic-dashboard-with-real-time-data-visualization-elements/dfb1c6b1a069f25d9baa3c16197001e6/>PikWizard</a>
</span>
</span>
<span class="image-link">
<span
style="margin: 0 0 20px 0; display: inline-block; vertical-align: middle; width: 100%;"
>
<a
target="_blank"
href="https://pikwizard.com/photo/dynamic-dashboard-with-real-time-data-visualization-elements/dfb1c6b1a069f25d9baa3c16197001e6/"
style="text-decoration: none; font-size: 10px; margin: 0;"
>
<img src="https://pikwizard.com/pw/medium/dfb1c6b1a069f25d9baa3c16197001e6.jpg" style="margin: 0; width: 100%;" alt="" />
<p style="font-size: 12px; margin: 0;">PikWizard</p>
</a>
</span>
</span>
Free (free of charge)
Free for personal and commercial use.
Author: Authentic Images