- Home >
- Stock Photos >
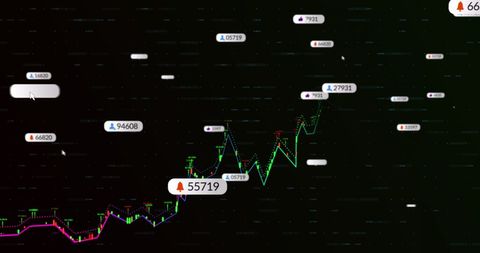
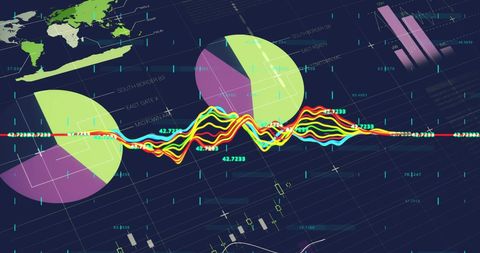
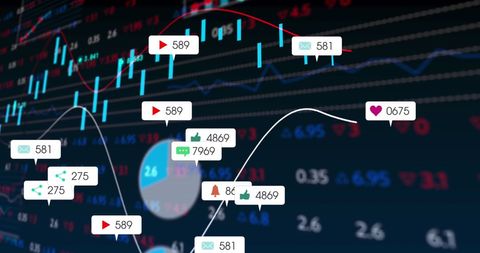
- Dynamic Data Analysis Chart on Dark Technological Background
Dynamic Data Analysis Chart on Dark Technological Background Image

Vibrant composite chart superimposed on black high-tech background symbolizes advanced data processing and global finance trends. Complex visualization suggests themes of technology and digital transformations useful for presentations, reports, and articles on fintech, data science, and financial analysis.

downloads
Tags:
More
Credit Photo
If you would like to credit the Photo, here are some ways you can do so
Text Link
photo Link
<span class="text-link">
<span>
<a target="_blank" href=https://pikwizard.com/photo/dynamic-data-analysis-chart-on-dark-technological-background/ab4d35b98fbf3da81d9ef04c676d9f98/>PikWizard</a>
</span>
</span>
<span class="image-link">
<span
style="margin: 0 0 20px 0; display: inline-block; vertical-align: middle; width: 100%;"
>
<a
target="_blank"
href="https://pikwizard.com/photo/dynamic-data-analysis-chart-on-dark-technological-background/ab4d35b98fbf3da81d9ef04c676d9f98/"
style="text-decoration: none; font-size: 10px; margin: 0;"
>
<img src="https://pikwizard.com/pw/medium/ab4d35b98fbf3da81d9ef04c676d9f98.jpg" style="margin: 0; width: 100%;" alt="" />
<p style="font-size: 12px; margin: 0;">PikWizard</p>
</a>
</span>
</span>
Free (free of charge)
Free for personal and commercial use.
Author: People Creations