- Home >
- Stock Photos >
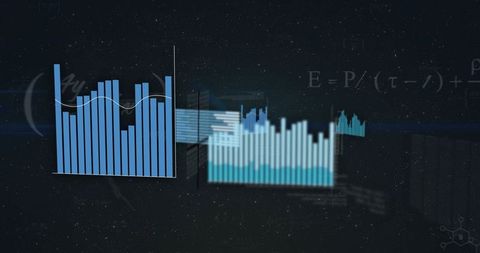
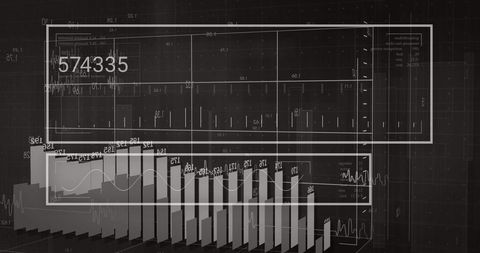
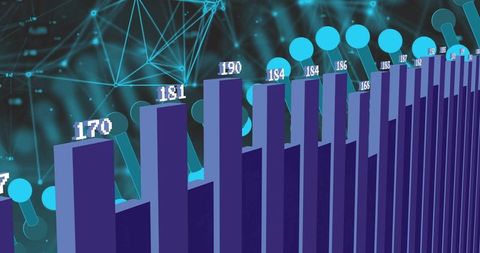
- Dynamic Data Analysis with Overlapping Blue Bar Graphs
Dynamic Data Analysis with Overlapping Blue Bar Graphs Image
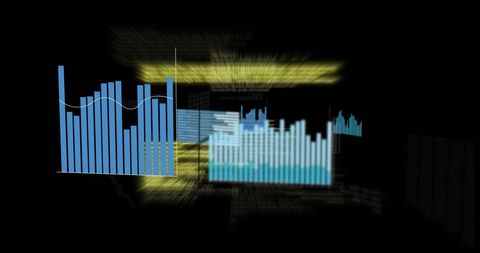
Overlapping blue bar graphs and blurred code snippets depict the concept of data analytics and visualization. Suitable for use in presentations about data science, reports on analytics techniques, educational materials on coding and statistics, or infographics demonstrating digital development. Ideal for backgrounds or illustrations in technology and business contexts focused on data-driven decision making.

downloads
Tags:
More
Credit Photo
If you would like to credit the Photo, here are some ways you can do so
Text Link
photo Link
<span class="text-link">
<span>
<a target="_blank" href=https://pikwizard.com/photo/dynamic-data-analysis-with-overlapping-blue-bar-graphs/c4d63fcc239bdf516c1f434f855fc908/>PikWizard</a>
</span>
</span>
<span class="image-link">
<span
style="margin: 0 0 20px 0; display: inline-block; vertical-align: middle; width: 100%;"
>
<a
target="_blank"
href="https://pikwizard.com/photo/dynamic-data-analysis-with-overlapping-blue-bar-graphs/c4d63fcc239bdf516c1f434f855fc908/"
style="text-decoration: none; font-size: 10px; margin: 0;"
>
<img src="https://pikwizard.com/pw/medium/c4d63fcc239bdf516c1f434f855fc908.jpg" style="margin: 0; width: 100%;" alt="" />
<p style="font-size: 12px; margin: 0;">PikWizard</p>
</a>
</span>
</span>
Free (free of charge)
Free for personal and commercial use.
Author: Awesome Content