- Home >
- Stock Photos >
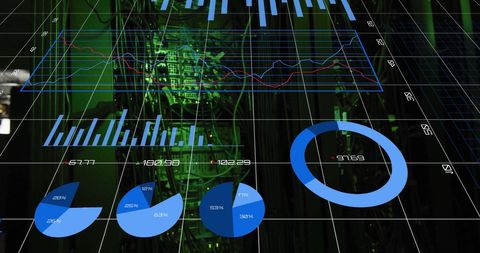
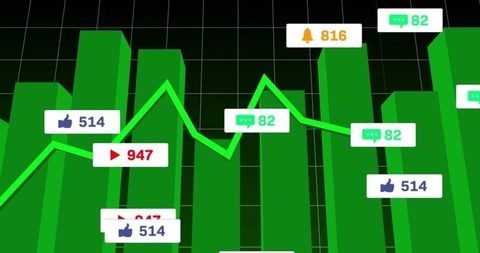
- Dynamic Data Analytics on Digital Interface
Dynamic Data Analytics on Digital Interface Image

Digital display showcasing interactive green bar charts and fluid line graph with overlay gauges. Ideal for depicting trends, analyzing performance metrics, or enhancing presentations. Useful for business reports, financial analyses, technology demonstrations, and educational materials exploring data understanding.

downloads
Tags:
More
Credit Photo
If you would like to credit the Photo, here are some ways you can do so
Text Link
photo Link
<span class="text-link">
<span>
<a target="_blank" href=https://pikwizard.com/photo/dynamic-data-analytics-on-digital-interface/6f979c78af89155c2cb660a47e93040a/>PikWizard</a>
</span>
</span>
<span class="image-link">
<span
style="margin: 0 0 20px 0; display: inline-block; vertical-align: middle; width: 100%;"
>
<a
target="_blank"
href="https://pikwizard.com/photo/dynamic-data-analytics-on-digital-interface/6f979c78af89155c2cb660a47e93040a/"
style="text-decoration: none; font-size: 10px; margin: 0;"
>
<img src="https://pikwizard.com/pw/medium/6f979c78af89155c2cb660a47e93040a.jpg" style="margin: 0; width: 100%;" alt="" />
<p style="font-size: 12px; margin: 0;">PikWizard</p>
</a>
</span>
</span>
Free (free of charge)
Free for personal and commercial use.
Author: Authentic Images