- Home >
- Stock Photos >
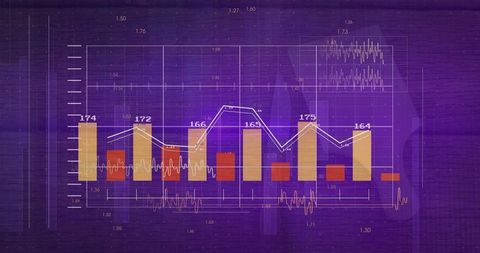
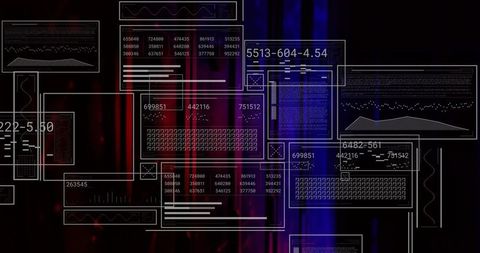
- Dynamic Data Analytics on Red Digital Interface
Dynamic Data Analytics on Red Digital Interface Image

This digital composition features a visually arresting interface with bar and line graphs depicting performance metrics and data analytics in real-time over a red background. Ideal for projects involving financial reports, tech commercialization, dashboard development, or performance tracking presentations, highlighting advanced data analysis tools and interactive design. Useful in programs showcasing technological progress and digital innovation.

downloads
Tags:
More
Credit Photo
If you would like to credit the Photo, here are some ways you can do so
Text Link
photo Link
<span class="text-link">
<span>
<a target="_blank" href=https://pikwizard.com/photo/dynamic-data-analytics-on-red-digital-interface/b656579a1b2ab7040fece0be0f17d6d8/>PikWizard</a>
</span>
</span>
<span class="image-link">
<span
style="margin: 0 0 20px 0; display: inline-block; vertical-align: middle; width: 100%;"
>
<a
target="_blank"
href="https://pikwizard.com/photo/dynamic-data-analytics-on-red-digital-interface/b656579a1b2ab7040fece0be0f17d6d8/"
style="text-decoration: none; font-size: 10px; margin: 0;"
>
<img src="https://pikwizard.com/pw/medium/b656579a1b2ab7040fece0be0f17d6d8.jpg" style="margin: 0; width: 100%;" alt="" />
<p style="font-size: 12px; margin: 0;">PikWizard</p>
</a>
</span>
</span>
Free (free of charge)
Free for personal and commercial use.
Author: Awesome Content