- Home >
- Stock Photos >
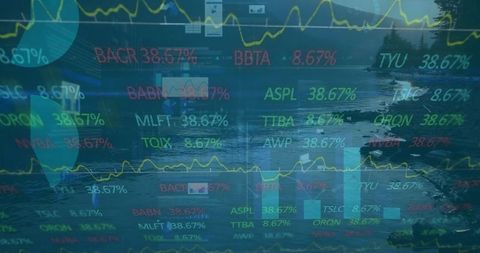
- Dynamic Data Analytics with Digital Graphs Overlay
Dynamic Data Analytics with Digital Graphs Overlay Image

This futuristic artwork blends red and blue graph lines showcasing percentage changes against a dark, grid-like background, creating a vivid display ideal for visualizing complex data. Overlaid coding elements enhance the high-tech feel, symbolizing cutting-edge financial analytics and advanced technology applications. Suitable for businesses or projects in the technology, finance, and data sectors and could be effectively used in presentations, multimedia projects, or digital marketing materials highlighting modern analytics or trends analysis capabilities.

downloads
Tags:
More
Credit Photo
If you would like to credit the Photo, here are some ways you can do so
Text Link
photo Link
<span class="text-link">
<span>
<a target="_blank" href=https://pikwizard.com/photo/dynamic-data-analytics-with-digital-graphs-overlay/86e09c5bcacbeaee455cb5cf999f63c7/>PikWizard</a>
</span>
</span>
<span class="image-link">
<span
style="margin: 0 0 20px 0; display: inline-block; vertical-align: middle; width: 100%;"
>
<a
target="_blank"
href="https://pikwizard.com/photo/dynamic-data-analytics-with-digital-graphs-overlay/86e09c5bcacbeaee455cb5cf999f63c7/"
style="text-decoration: none; font-size: 10px; margin: 0;"
>
<img src="https://pikwizard.com/pw/medium/86e09c5bcacbeaee455cb5cf999f63c7.jpg" style="margin: 0; width: 100%;" alt="" />
<p style="font-size: 12px; margin: 0;">PikWizard</p>
</a>
</span>
</span>
Free (free of charge)
Free for personal and commercial use.
Author: Creative Art