
- Home >
- Stock Photos >
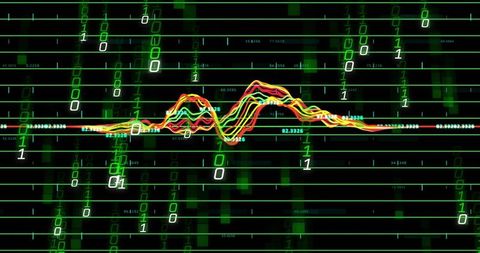
- Dynamic Data and Graphs on Digital Screen
Dynamic Data and Graphs on Digital Screen Image

The image shows a complex display of data and graphs on a digital screen, conveying themes related to finance, technology, and global economics. Bright lines and nodes suggest connections in a network, indicating data flow and digital analytics. This visual can be used for presentations or publications in topics involving technology trends, market analysis, and innovative computing solutions.
Powered by 


downloads
Tags:
More
Credit Photo
If you would like to credit the Photo, here are some ways you can do so
Text Link
photo Link
<span class="text-link">
<span>
<a target="_blank" href=https://pikwizard.com/photo/dynamic-data-and-graphs-on-digital-screen/561c3f802ddfa46c3cfa208fc3c91497/>PikWizard</a>
</span>
</span>
<span class="image-link">
<span
style="margin: 0 0 20px 0; display: inline-block; vertical-align: middle; width: 100%;"
>
<a
target="_blank"
href="https://pikwizard.com/photo/dynamic-data-and-graphs-on-digital-screen/561c3f802ddfa46c3cfa208fc3c91497/"
style="text-decoration: none; font-size: 10px; margin: 0;"
>
<img src="https://pikwizard.com/pw/medium/561c3f802ddfa46c3cfa208fc3c91497.jpg" style="margin: 0; width: 100%;" alt="" />
<p style="font-size: 12px; margin: 0;">PikWizard</p>
</a>
</span>
</span>
Free (free of charge)
Free for personal and commercial use.
Author: Authentic Images
Similar Free Stock Images

Premium


Premium

Premium


Premium

Premium


Premium


Premium


Premium


Premium


Premium


Premium

Premium


Premium


Premium


Premium


Premium


Premium

Premium


Premium


Premium


Premium


Premium


Premium


Premium


Premium

Explore More Free Stock Images