
- Home >
- Stock Photos >
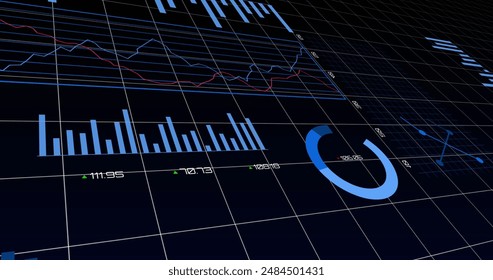
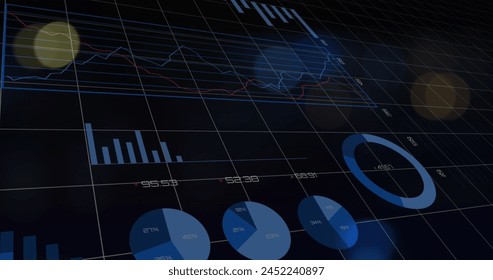
- Dynamic Data and Statistics Display on Purple Background
Dynamic Data and Statistics Display on Purple Background Image

Stylized visual representation depicting dynamic data and statistics against a vivid purple background. Bars and waves indicate analytic processes, suitable for presentations on financial analysis, data science projects, or digital innovation showcases.
Powered by  - Get 15% off with code: PIKWIZARD15


Credit Photo
If you would like to credit the Photo, here are some ways you can do so
Text Link
photo Link
<span class="text-link">
<span>
<a target="_blank" href=https://pikwizard.com/photo/dynamic-data-and-statistics-display-on-purple-background/8583b566ae26a2135f42455bbd8e86a7/>PikWizard</a>
</span>
</span>
<span class="image-link">
<span
style="margin: 0 0 20px 0; display: inline-block; vertical-align: middle; width: 100%;"
>
<a
target="_blank"
href="https://pikwizard.com/photo/dynamic-data-and-statistics-display-on-purple-background/8583b566ae26a2135f42455bbd8e86a7/"
style="text-decoration: none; font-size: 10px; margin: 0;"
>
<img src="https://pikwizard.com/pw/medium/8583b566ae26a2135f42455bbd8e86a7.jpg" style="margin: 0; width: 100%;" alt="" />
<p style="font-size: 12px; margin: 0;">PikWizard</p>
</a>
</span>
</span>
Free (free of charge)
Free for personal and commercial use.
Author: People Creations
Similar Free Stock Images

Premium


Premium


Premium


Premium


Premium

Premium


Premium


Premium


Premium


Premium


Premium


Premium


Premium

Premium


Premium


Premium


Premium

Premium

Premium


Premium


Premium

Premium


Premium


Premium


Premium


Explore More Free Stock Images