- Home >
- Stock Photos >
- Dynamic Data Dashboard with Graphs and Analytics Visualizations
Dynamic Data Dashboard with Graphs and Analytics Visualizations Image

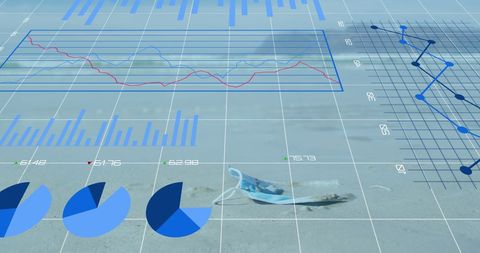
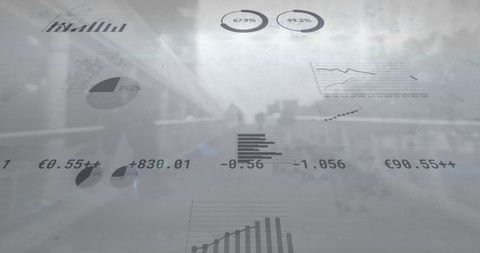
This display showcases a multi-layered data dashboard replete with graphs such as bar charts, line graphs, and waveform plots, highlighted by a subtle pink-orange color overlay. Ideal for presentations on data analytics, technological advancements, and modern business intelligence tools. It is perfect for use in educational materials, tech company websites, or books on data science and engineering.

downloads
Tags:
More
Credit Photo
If you would like to credit the Photo, here are some ways you can do so
Text Link
photo Link
<span class="text-link">
<span>
<a target="_blank" href=https://pikwizard.com/photo/dynamic-data-dashboard-with-graphs-and-analytics-visualizations/3b823db3c898a0b7ba5017311c5cd324/>PikWizard</a>
</span>
</span>
<span class="image-link">
<span
style="margin: 0 0 20px 0; display: inline-block; vertical-align: middle; width: 100%;"
>
<a
target="_blank"
href="https://pikwizard.com/photo/dynamic-data-dashboard-with-graphs-and-analytics-visualizations/3b823db3c898a0b7ba5017311c5cd324/"
style="text-decoration: none; font-size: 10px; margin: 0;"
>
<img src="https://pikwizard.com/pw/medium/3b823db3c898a0b7ba5017311c5cd324.jpg" style="margin: 0; width: 100%;" alt="" />
<p style="font-size: 12px; margin: 0;">PikWizard</p>
</a>
</span>
</span>
Free (free of charge)
Free for personal and commercial use.
Author: Authentic Images