
- Home >
- Stock Photos >
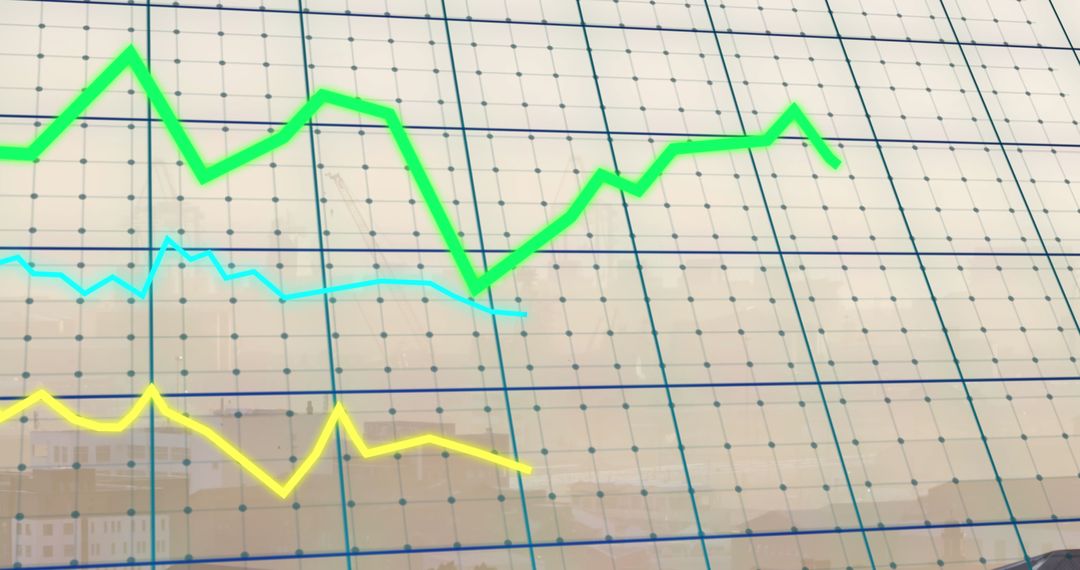
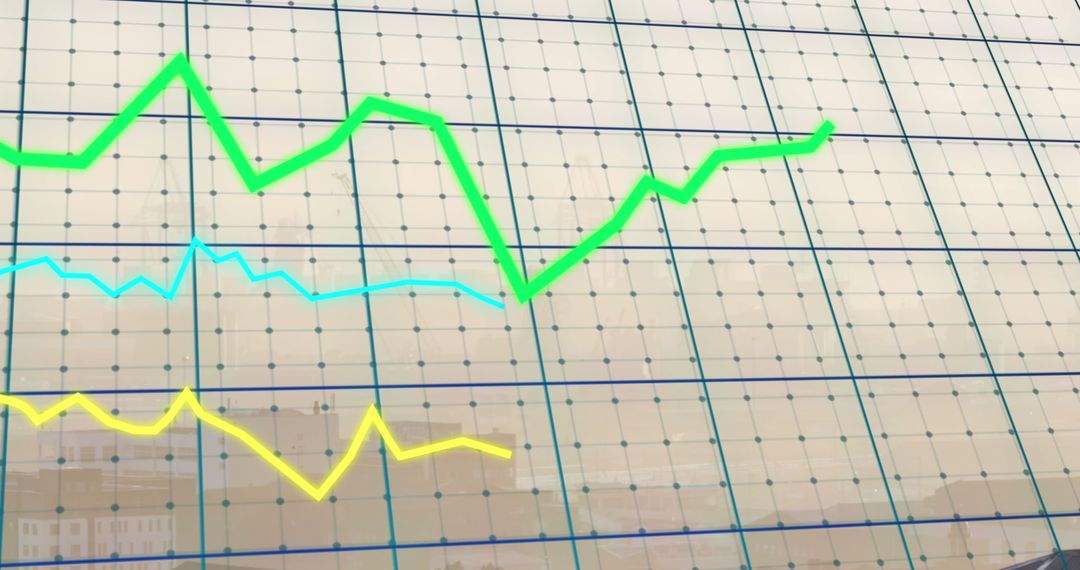
- Dynamic Data Graphs Illustrate Financial Market Trends
Dynamic Data Graphs Illustrate Financial Market Trends Image

Digital representation showcases dynamic data graphs indicating stock market trends. Useful for illustrating investment opportunities and economic analysis in financial reports, presentations on connecting data with business decisions, and supporting educational content on economic theories.
Powered by  - Get 15% off with code: PIKWIZARD15


2
downloads
downloads
Tags:
More
Credit Photo
If you would like to credit the Photo, here are some ways you can do so
Text Link
photo Link
<span class="text-link">
<span>
<a target="_blank" href=https://pikwizard.com/photo/dynamic-data-graphs-illustrate-financial-market-trends/783b9f9313382f758093657e80a5e83e/>PikWizard</a>
</span>
</span>
<span class="image-link">
<span
style="margin: 0 0 20px 0; display: inline-block; vertical-align: middle; width: 100%;"
>
<a
target="_blank"
href="https://pikwizard.com/photo/dynamic-data-graphs-illustrate-financial-market-trends/783b9f9313382f758093657e80a5e83e/"
style="text-decoration: none; font-size: 10px; margin: 0;"
>
<img src="https://pikwizard.com/pw/medium/783b9f9313382f758093657e80a5e83e.jpg" style="margin: 0; width: 100%;" alt="" />
<p style="font-size: 12px; margin: 0;">PikWizard</p>
</a>
</span>
</span>
Free (free of charge)
Free for personal and commercial use.
Author: Authentic Images
Similar Free Stock Images

Premium


Premium


Premium


Premium


Premium


Premium


Premium


Premium


Premium


Premium


Premium


Premium


Premium


Premium


Premium


Premium


Premium


Premium


Premium


Premium


Premium


Premium


Premium


Premium

