- Home >
- Stock Photos >
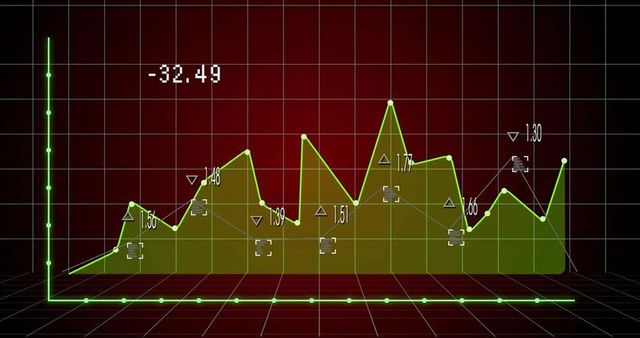
- Dynamic Data Graphs on Digital Interface Background
Dynamic Data Graphs on Digital Interface Background Image

Visual depiction of connected graphs and data points on digital background, ideal for representing data visualization, technological advancements, global networking, and communication in financial and scientific contexts. Useful for presentations on modern technology and interconnected systems.

downloads
Tags:
More
Credit Photo
If you would like to credit the Photo, here are some ways you can do so
Text Link
photo Link
<span class="text-link">
<span>
<a target="_blank" href=https://pikwizard.com/photo/dynamic-data-graphs-on-digital-interface-background/7ca8d3f09c2a6f15c76ac4dcbb43ec1c/>PikWizard</a>
</span>
</span>
<span class="image-link">
<span
style="margin: 0 0 20px 0; display: inline-block; vertical-align: middle; width: 100%;"
>
<a
target="_blank"
href="https://pikwizard.com/photo/dynamic-data-graphs-on-digital-interface-background/7ca8d3f09c2a6f15c76ac4dcbb43ec1c/"
style="text-decoration: none; font-size: 10px; margin: 0;"
>
<img src="https://pikwizard.com/pw/medium/7ca8d3f09c2a6f15c76ac4dcbb43ec1c.jpg" style="margin: 0; width: 100%;" alt="" />
<p style="font-size: 12px; margin: 0;">PikWizard</p>
</a>
</span>
</span>
Free (free of charge)
Free for personal and commercial use.
Author: Awesome Content