1. Home > 
  2. Stock Photos > 
  3. Dynamic Data Processing with Digital Interfaces in Motion

Dynamic Data Processing with Digital Interfaces in Motion Image

Dynamic Data Processing with Digital Interfaces in Motion

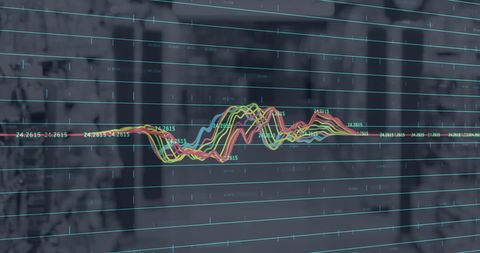
A vibrant and intricate display of data processing against a dark background highlights technological concepts. Ideal for contexts involving global business strategies, digital advancements, financial markets projections, or technology-themed presentations. This image can be effectively utilized in presentations, websites, or reports discussing innovative business solutions or virtual environments.

Powered by Shutterstock logo - Get 15% off with code: PIKWIZARD15
Scientist working with business data, finance, marketing report, Big Data Analytics technology, Processing Complexity information flow on virtual screen, machine learning, artificial intelligence, ML - Powered by Shutterstock - Get 15% off with code: PIKWIZARD15Business developer using Kanban board framework on laptop computer. Agile software development lean project management tool, project management, business development concept - Powered by Shutterstock - Get 15% off with code: PIKWIZARD15Man Typing Keyboard Laptop Hand.Project Manager Researching Process.Business Team Working Startup modern Office.Global Strategy Virtual Icon.Innovation Graphs Interfaces.Analyze market stock.Blurred - Powered by Shutterstock - Get 15% off with code: PIKWIZARD15Python Programming Web Development Coding Concept.Software development concepts and programming for various devices, Software Engineer Computer programming, coding process, chart, and Data analytics. - Powered by Shutterstock - Get 15% off with code: PIKWIZARD15Online documentation database and document management system concept. Process automation to efficiently manage files. - Powered by Shutterstock - Get 15% off with code: PIKWIZARD15

Credit Photo

If you would like to credit the Photo, here are some ways you can do so

Free (free of charge)

Free for personal and commercial use.

Author: Creative Art

Similar Free Stock Images

Dynamic Stock Market Chart with Colorful Trend Lines
Premium
Businessman analyze and visualize complex information on a virtual screen using AI to process data. Big data technology and data science.Data flow.Digital neural network.artificial intelligence
Abstract Data Analysis Overlay on Coastal Landscape
Dynamic Stock Market Data Visualization on Digital Screen
Dynamic Stock Market Analysis with Trend Lines
Diverse Data and Graphs on Digital Screen for Global Business Concepts
Premium
Big data analytics and business intelligence concept with chart and graph icons on a digital screen interface and a businessman in background
Abstract Network Visualization with Woman's Profile and Digital Data
Red Financial Trendline in Digital Interface Background
Abstract Financial Graphs with Rising Trends and Positive Indicators
Dynamic Financial Graphs and Charts on Black Background
Premium
Project management software on the screen of laptop computer
Digital Data Visualization Over World Map in Network Concept
Digital Network Connections and Financial Data Analysis
Dynamic Financial Data Displayed on Neon Graphs
Dynamic Data Processing Concept in Digital Interface Design
Premium
Factory Female Industrial Engineer working with automation robot arms machine in intelligent factory industrial on real time monitoring system software.Digital future manufacture.
Financial Data Visualization Above Cityscape
Dynamic Stock Market Data Display with Vibrant Graph Overlays
Futuristic Data Analytics with Virtual Graph over Digital Grid
Abstract Financial Data Streams Over Cityscape Background
Premium
Close-up of hands typing on a laptop with a transparent digital interface showing a project timeline or Gantt chart, representing smart project management, planning, and AI-driven scheduling.
Digital Data Analysis Over Cityscape with Scope Overlay
Global Financial Data Network Visualization on World Map
Data Processing with Digital Interface and Code Background
Digital Data Processing and Global Connectivity Illustrated
Premium
Data scientists. Man programmer using laptop analyzing and development at various information on futuristic virtual interface screen. Algorithm. marketing and deep learning of artificial intelligence
Dynamic Financial Data Trends with Fluctuating Graphs and Charts
Dynamic Cybersecurity Interface with Lock and Data Charts
Futuristic Data Visualization Interface with Globe and Analytics
Futuristic Digital Dashboard with Neon Line Charts Analysis
3D Financial Data Stream with Floating Digital Icons
Financial Graphs with Globally Inspired Data Visualization
Premium
Man look at the dashboard with graphs and charts. Concept of data management system, business intelligence, data statistics, marketing analysis, key performance indicators (KPI) and analytics.
Dynamic Financial Data Display Over Global Stock Market
Global Financial Data Analytics Over Digital World Map
Data Analysis and Graphs Displaying Stock Market Trends
Dynamic Financial Data Charts on Dark Digital Background
Premium
Data management, Business developer using Kanban board framework on laptop computer. Agile software development, document, database management concept. Business and technology background
Dynamic Data Processing with Colorful Visual Analytics Interface
Dynamic Financial Graphs Illustrating Market Trends and Data
Financial Data Visualization in Server Room Setting
Digital Data Processing on Interconnected Network
Premium
Business developer using Kanban board framework on laptop computer. Agile software development lean project management tool for fast changes, project management concept
Abstract Network Connections with Financial Data Overlay
Financial Data Overlaid on City Skyline
Digital Financial Graphs and Market Data Analysis
Dynamic Data and Graphs on Digital Screen
Premium
Hand touching modern interface digital transformation and metaverse concept. Connection next generation technology and new era of innovation.
Complex Digital Financial Data on Grid
Abstract Digital Network with Colorful Data Lines and Shapes
Dynamic Neon Lines with Data Streams Over Digital Grid
Soundwave Visualization and Data Analysis on Digital Grid
Premium
Businessman using digital tablet with AI icon and data analytics interface. Concept of artificial intelligence, big data, machine learning, innovation and digital transformation in technology business
Financial Market Data Visualization with Global Chart Overlay
Abstract Robotic Arm Analyzing Digital Financial Graphs for AI-Based Trading
Abstract Digital Data Processing with Visual Firewall Concept
Global Data Analysis on Digital Interface World Map
Premium
Software Engineer and Software development concepts,  programming for various devices, computer programmer, coding process, chart, testing platform Data analytics, online safety.
Futuristic Neon Data Wave Visualization in Cyber Grid Display
Abstract Neon Waveforms on Digital Grid Layout
Digital Analytics Dashboard with Gray Vertical Bars and Line Graphs
Abstract Digital Finance Graph Interface Display
Futuristic Financial Graphs with Dynamic Green Line
Futuristic Data Visualization Oscillation Concept
Premium
Data Science and engineering, digital technology, tech background. Software engineer working with database and big data analytics, cloud computing with AI and data exchange, innovation technology
Financial Graph Overlaying Retail Store Backdrop Visualizing Market Trends
Futuristic Digital Data Analysis with Vibrant Graphs
Financial Data Analysis Graph with Growing Trends
Abstract Financial Data Visualization with Light Bokeh
Premium
cloud technology concept Global network of metaverse systems exchange of information global business Megatrends on the Internet for Telecommunication
Digital Globe with Intersecting Graphs Representing Global Economy
Abstract Financial Data with Digitally Enhanced Graphs
Cybernetic Data Flow with Digital Network Connections
Financial Data Visualization with Network of Connections
Premium
Data science. Man programmer using digital tablet computer analyzing and develop software on futuristic virtual interface screen. Algorithm, big data analysis and management, data visualization
Dynamic Financial Data Charts in Modern Office Background
Abstract Data Visualization with Digital Interface Overlays
Dynamic Digital Data Display with Vibrant Graphs
Dynamic Red Line Graph on Digital Black Grid Background
Premium
Image of data processing over caucasian server room worker. Global science, connections, data processing and digital interface concept digitally generated image.
Abstract Digital Graph with Fluctuating Connectivity Lines
Neon Circular Patterns with Dynamic Data Interface
Abstract Financial Data Interface with Dynamic Chart Lines
Financial Data and Stock Market Trends Overlaying Cityscape
Premium
Image of network of connections over students using computer. Global business data processing and digital interface concept digitally generated image.
Digital Interface with Data Processing and Security Elements
Futuristic Data Map With Multi-Color Graph Lines
Digital Finance Graph with Data Points on Dark Background
Abstract Financial Data Visualization Superimposed on Retail Space
Premium
Business process and workflow automation with flowchart. Hand holding wooden cube block arranging processing management on white background
Innovative Digital Analysis Waveform with Futuristic Interface
Neon waveform bundle oscillating across futuristic digital dashboard with grid and data markers
Dynamic Financial Data Over Abstract Background
Dynamic Stock Market and Financial Data Analysis Concept
Dynamic Financial Data Streams for Market Analysis
Dynamic Financial Data Processing Showing Stock Market Interface
Premium
Data science, business analysis and strategy, big data concept.Business teamwork analyzing financial graph on virtual touch screen, futuristic technology solution for business development
Digital Financial Data Overlay on Retail Environment
Security Hologram Over Digital Stock Market Analysis
Futuristic Financial Data Analysis with Dynamic Charts and Graphs
Digital Data Visualization with Futuristic Infographics
Premium
Man look at the dashboard with graphs and charts. Concept of data management system, business intelligence, data statistics, marketing analysis, key performance indicators (KPI) and analytics.
Financial Data Processing Over Digital Cityscape
Abstract Financial Data Visualization with Multicolored Graphs
Financial Data and Network Connections Over Black Background
Glowing Data Graph Overlay on Spinning Black Globe
Premium
Man interacting with a holographic touchscreen interface in red color. Concept of cyber attack, malware, data breach, system hacking, virus, spyware, compromised information and urgent attention.
Digital Data Analysis on Futuristic Interface Background
Global Financial Technology Network and Data Analytics
Futuristic Data Analysis Overlaying Cityscape Digital Interface
Illuminated Financial Data Chart Display on Dark Backdrop
Premium
businessman holding a virtual interface with AI agents icons. automation, smart business solutions, and digital transformation. machine learning, data processing, and artificial intelligence.
Abstract Neon Data Tunnel with Dynamic Numbers Overlay
Dynamic Stock Market Graph on Digital Interface
Global Financial Data Overlay with Coding Elements
Abstract Stock Market Graph with Digital Data Animation
Premium
Strategic Planning and Analysis in Business Project Management
Global Financial Data with Dynamic Analytics Visualization
Financial Data Analysis with Digital Network Connectivity
Futuristic Digital Data Network with Analytics Overlay
Colorful Digital Waveform with Analytical Overlay and Red Grid Lines
Premium
Image of financial data over diverse female teacher and diverse female school kids using electronic devices. Global business data processing digital interface and technology concept digitally
Neon Binary Waveform Dashboard Visualizing Real-Time Data Stream and Signal Patterns