- Home >
- Stock Photos >
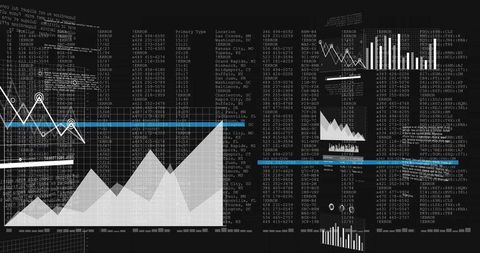
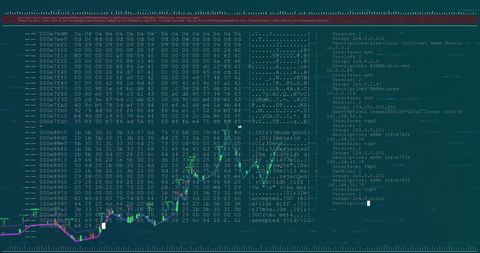
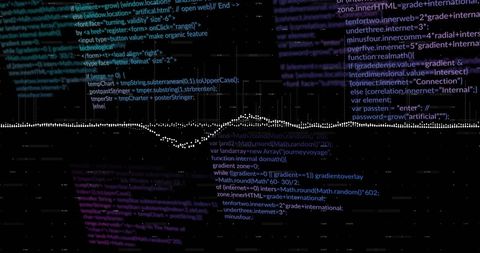
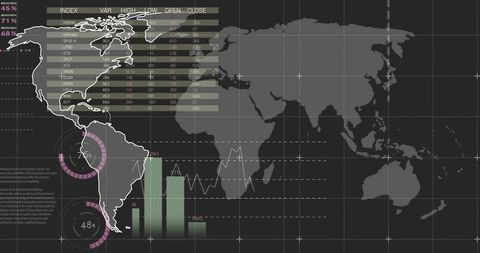
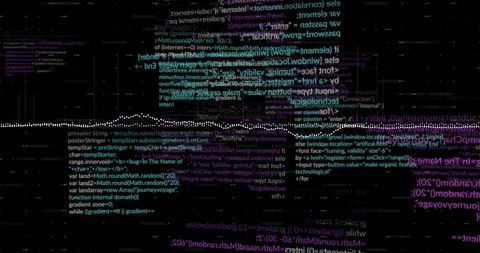
- Dynamic Data Streams with Code Overlay on Digital Interface
Dynamic Data Streams with Code Overlay on Digital Interface Image

Dynamic and abstract portrayal of data streams mixed with diverse sets of code, highlighted over a digital grid background. Ideal for use in themes related to big data, complex algorithms, data analysis, and advanced programming concepts. Perfect visual representation for technology publications, presentations focusing on digital transformation, or as background for blogs dedicated to coding and networks.

downloads
Tags:
More
Credit Photo
If you would like to credit the Photo, here are some ways you can do so
Text Link
photo Link
<span class="text-link">
<span>
<a target="_blank" href=https://pikwizard.com/photo/dynamic-data-streams-with-code-overlay-on-digital-interface/aef4bae45d8ee3f64685c80c2aad646e/>PikWizard</a>
</span>
</span>
<span class="image-link">
<span
style="margin: 0 0 20px 0; display: inline-block; vertical-align: middle; width: 100%;"
>
<a
target="_blank"
href="https://pikwizard.com/photo/dynamic-data-streams-with-code-overlay-on-digital-interface/aef4bae45d8ee3f64685c80c2aad646e/"
style="text-decoration: none; font-size: 10px; margin: 0;"
>
<img src="https://pikwizard.com/pw/medium/aef4bae45d8ee3f64685c80c2aad646e.jpg" style="margin: 0; width: 100%;" alt="" />
<p style="font-size: 12px; margin: 0;">PikWizard</p>
</a>
</span>
</span>
Free (free of charge)
Free for personal and commercial use.
Author: People Creations