
- Home >
- Stock Photos >
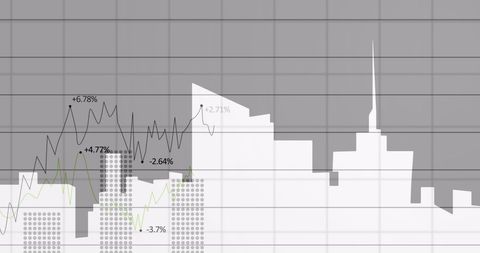
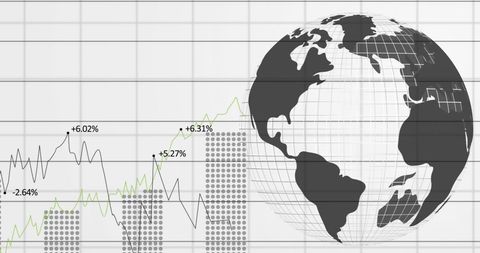
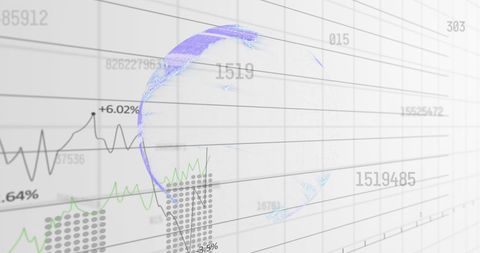
- Dynamic Data Trends with Line and Bar Graphs
Dynamic Data Trends with Line and Bar Graphs Image
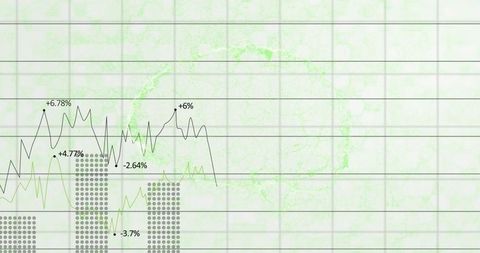
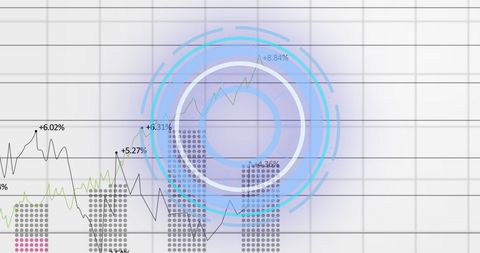
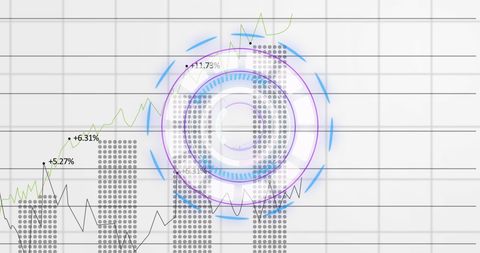
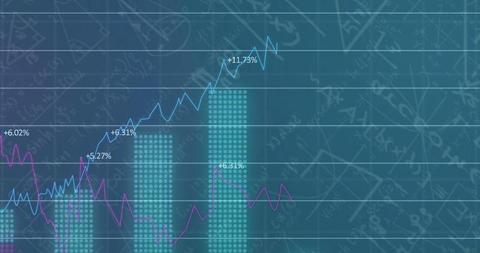
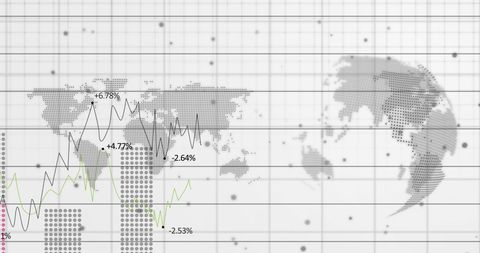
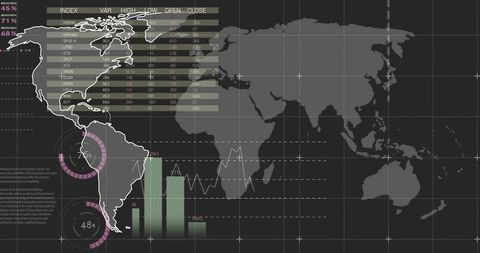
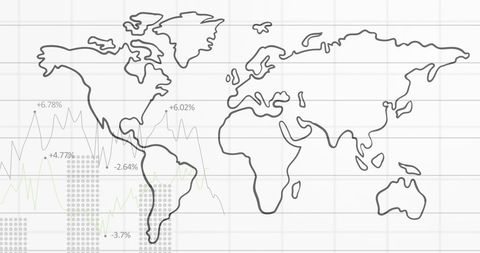
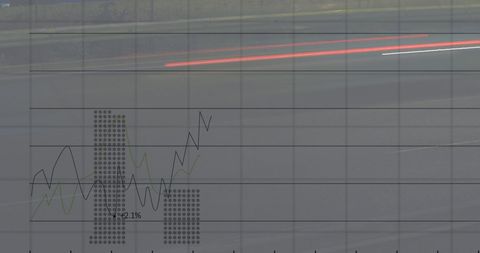
Illustrates data patterns using combination of line and bar graphs on grid with subtle world map backdrop. Suitable for business analytics, presentations, data insight reports, and financial reviews showcasing varied trends.
Powered by 


downloads
Tags:
More
Credit Photo
If you would like to credit the Photo, here are some ways you can do so
Text Link
photo Link
<span class="text-link">
<span>
<a target="_blank" href=https://pikwizard.com/photo/dynamic-data-trends-with-line-and-bar-graphs/211d4c28f97aa59cc4f7218dd6795812/>PikWizard</a>
</span>
</span>
<span class="image-link">
<span
style="margin: 0 0 20px 0; display: inline-block; vertical-align: middle; width: 100%;"
>
<a
target="_blank"
href="https://pikwizard.com/photo/dynamic-data-trends-with-line-and-bar-graphs/211d4c28f97aa59cc4f7218dd6795812/"
style="text-decoration: none; font-size: 10px; margin: 0;"
>
<img src="https://pikwizard.com/pw/medium/211d4c28f97aa59cc4f7218dd6795812.jpg" style="margin: 0; width: 100%;" alt="" />
<p style="font-size: 12px; margin: 0;">PikWizard</p>
</a>
</span>
</span>
Free (free of charge)
Free for personal and commercial use.
Author: People Creations
Similar Free Stock Images
Loading...

Premium


Premium

Premium


Premium


Premium


Premium


Premium


Premium


Premium

Premium

Premium


Premium


Premium


Premium


Premium


Premium

Premium

Premium


Premium


Premium

Premium


Premium

Premium


Premium


Premium


Explore More Free Stock Images