
- Home >
- Stock Photos >
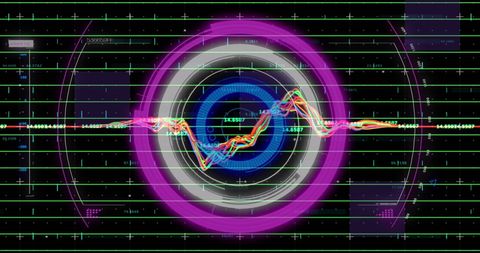
- Dynamic Data Visualisation with Futuristic Digital Display
Dynamic Data Visualisation with Futuristic Digital Display Image

This visual illustrates complex digital data processing within a futuristic interface, highlighted by interlacing lines and circular graphics in radiant greens. Perfect for use in presentations on cybersecurity, big data technology, or advanced analytics. This could be a compelling visual for articles on digital trends or technology blogs surrounding internet safety.
Powered by 


downloads
Tags:
More
Credit Photo
If you would like to credit the Photo, here are some ways you can do so
Text Link
photo Link
<span class="text-link">
<span>
<a target="_blank" href=https://pikwizard.com/photo/dynamic-data-visualisation-with-futuristic-digital-display/18b3c79d79f6ba09435016e9e119d532/>PikWizard</a>
</span>
</span>
<span class="image-link">
<span
style="margin: 0 0 20px 0; display: inline-block; vertical-align: middle; width: 100%;"
>
<a
target="_blank"
href="https://pikwizard.com/photo/dynamic-data-visualisation-with-futuristic-digital-display/18b3c79d79f6ba09435016e9e119d532/"
style="text-decoration: none; font-size: 10px; margin: 0;"
>
<img src="https://pikwizard.com/pw/medium/18b3c79d79f6ba09435016e9e119d532.jpg" style="margin: 0; width: 100%;" alt="" />
<p style="font-size: 12px; margin: 0;">PikWizard</p>
</a>
</span>
</span>
Free (free of charge)
Free for personal and commercial use.
Author: Awesome Content
Similar Free Stock Images

Premium


Premium


Premium

Premium


Premium


Premium


Premium


Premium


Premium


Premium


Premium

Premium


Premium


Premium


Premium

Premium


Premium


Premium


Premium


Premium


Premium


Premium


Premium

Premium


Premium

Explore More Free Stock Images