1. Home > 
  2. Stock Photos > 
  3. Dynamic Data Visualization and Statistics with Changing Numbers

Dynamic Data Visualization and Statistics with Changing Numbers Image

Dynamic Data Visualization and Statistics with Changing Numbers

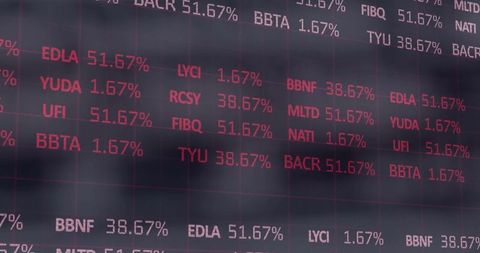
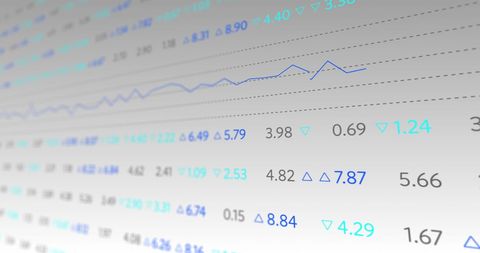
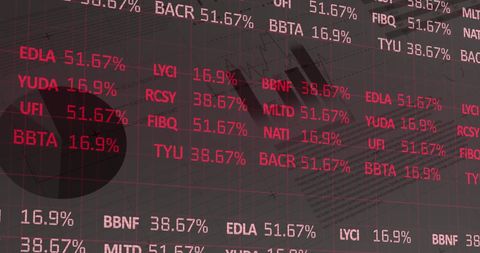
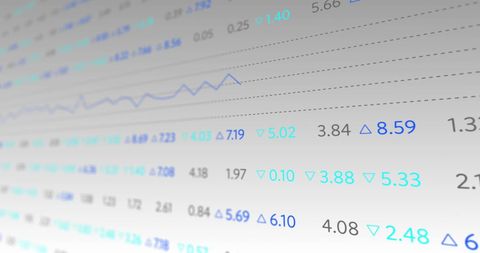
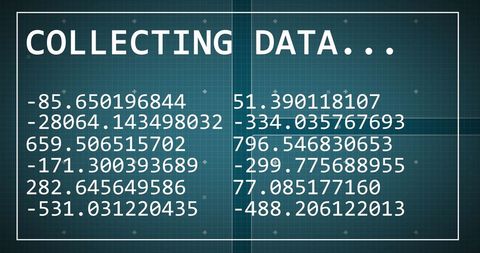
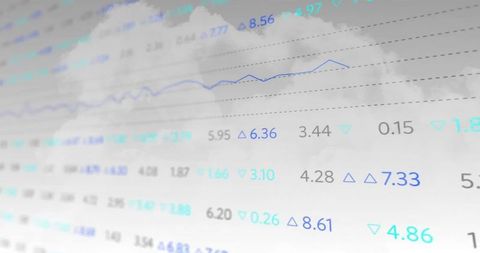
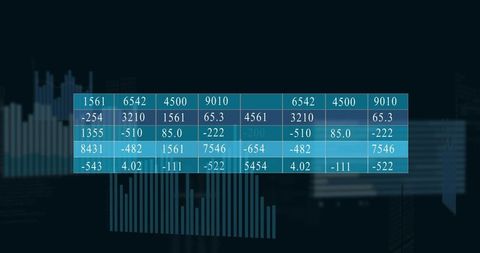
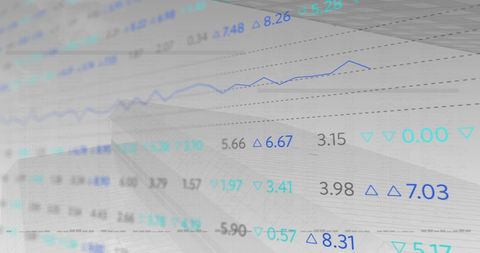
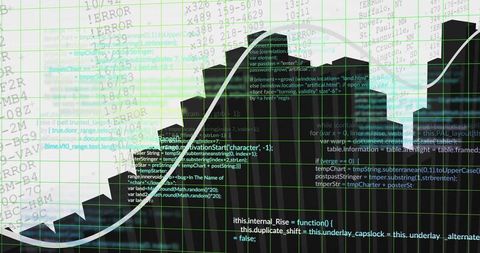
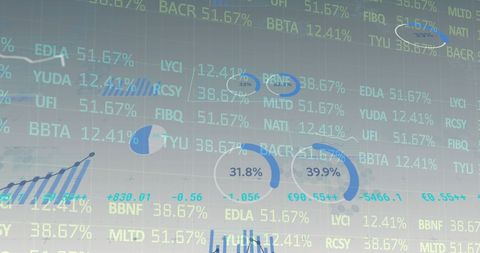
This image captures the essence of data processing and statistical analysis through a display of dynamic numbers and changing graphs. Valuable for illustrating concepts in financial reports, technology blogs, market analysis, or presentations about data trends and predictions. The combination of figures and visual data curves emphasizes growth and technological advancements.

Powered by Adobe logo
Big data technology data science analysis artificial intelligence generative ai deep learning machine learning algorithm neural flow network analytics innovation abstract futuristic. 3d rendering. - Powered by AdobeMagnifying glass focusing on candlestick chart, showcasing market analysis on a dark background, concept for financial review, investment strategy and business intelligence data analysis - Powered by AdobeBusiness intelligence analyst dashboard on virtual screen. Big data Graphs Charts. - Powered by AdobeHigh-resolution science laboratory background featuring double exposure of test tubes, beakers, and analytical charts on a blue glass surface, perfect for research themes - Powered by AdobeTeacher presenting report in classroom with graphs, effective learning - Powered by Adobe

Credit Photo

If you would like to credit the Photo, here are some ways you can do so

Free (free of charge)

Free for personal and commercial use.

Author: Authentic Images

Similar Free Stock Images

3D Bar and Line Graph with Digital Interface Elements
Premium
Business people analyzing financial charts and graphs at meeting
Financial Market Data Overlaid on Urban Skyline
Global Financial Data Overlaid on Modern Cityscape
Premium
Senior Businesswoman Presenting Growth Chart in Modern Office Meeting
Dynamic Financial Data on Digital Interface
Abstract Financial Data Processing and Stock Market Analysis
Global Financial Data Display with Graph Overlay
Ukraine Crisis Financial Graphs Overlay
Premium
Abstract glowing big data forex candlestick chart on blurry city backdrop. Trade, technology, investment and analysis concept
Financial Data on Digital Screen Displaying Stock Market Changes
Futuristic Business Dashboard with Data Analytics Background
Digital Financial Data on Transparent Glass Interface
Abstract Financial Data with Rising Trend Line on Green
Premium

Dynamic blue and green digital stock market graph with bar charts and lines on a dark background, representing financial data analysis, investment trends, business growth, and global economy fluctuat
Fluctuating Stock Market Data on Digital Screen
Digital Financial Data Processing on Dark Background
Dynamic Stock Market Charts with Financial Data
Stock Market Display with Dynamic Graphs and Numbers
Premium
Printed business documents with colorful charts and graphs being analyzed through a magnifying glass
Global Financial Data Analysis and Business Insights
Abstract Digital Data Charts and Graphs on Screen
Dynamic Stock Market Data on Digital Display Background
Dynamic Financial Data Stream Visualization in Network Grid
Premium
Female analyzing data on computer in modern office with charts and graphs displayed
Digital Data Flow with Encryption and Numbers on Grids
Digital Dashboard with Overlay of Transparent Data Charts and Code
Dynamic Financial Data and Graphs Background
Abstract Digital Data and Server Connections Concept
Digital Financial Data Analysis and Stock Market Visualization
Digital Financial Data Overlaps with Graph Analytics
Advanced Financial Data and Stock Market Analysis Background
Displaying Real-Time Stock Market Data with Digital Connection
Digital Data Collection Display on Futuristic Grid
Abstract Digital Finance and Data Analysis Background
Digital Data Processing with Abstract Green Rain Effects
Business Financial Data Analytics with Futuristic Elements
Premium
Ai generated image of laptop displaying financial data analysis charts and graphs isolated on transparent background
Premium
AI finance business data analysis digital technology investment trading market stock, financial analyst using advanced holographic interface for global market insight, smart investment strategy
Abstract Digital Counter with DNA Helix and Code Overlays
Abstract Data Analytics in Blue and Grey Tones
Global Financial Data Analytics with World Map Background
Interactive Analytics Dashboard Display with Error Indicators
Premium
Data Examination: A magnifying glass hovers over financial reports and charts on a sky-blue surface, providing an overview of the business analysis.
Premium
Visual representation of digital marketing metrics and ads on a futuristic interface, showcasing data analysis through charts and graphs in a modern business setting. Gantry
Digital Stock Market Data Displays Global Financial Trends
Dynamic Stock Market Data Display in Digital Hologram Interface
Futuristic Cityscape with Data Interface Overlay
Data Processing Code with Digital Interface Elements
Premium
Laptop, investment graphs and business woman reading IPO analytics, financial bank chart or accounting value, info or stocks. Trade price, admin data analysis and profile of broker review statistics
Abstract Business Data Visualization with Gradient Background
Colorful Graph with Digital Finance Interface and Data Overlay
Digital Financial Data Interface Display
Financial Data Processing Over Skyscraper Background in Modern Tech Scene
Premium
Team working with graphs and data on laptops and tablets at office table
Digital Stock Market Data Against Skyscraper Background
Financial Data Processing with Global Digital Interface
Armed Forces Day with Digital Graphs Overlaid
Data Processing with Global Digital Interface Analytics
Premium
Blue tone financial data charts for business analysis and reporting
Premium
Blue and orange digital charts and graphs on dark background, showcasing data analysis and business intelligence, representing growth and progress
Premium
Laptop displaying data analytics charts and graphs on a wooden desk in a cafe.
Dynamic Financial Data Visualization on Grey Background
Digital Data Visualization with Code and Error Logs on Futuristic Interface
Premium
Digital forest data analysis with glowing charts and bar graphs. Abstract concept of environmental economics finance and tech, showing growth and trends in nature.
Premium
Close-up of a digital display showing various charts and graphs in blue and orange hues, representing data analysis and business intelligence, ideal for technology or financial concepts
Fintech Visualization With Digital Number Interface
Digital Financial Analytics with Real-time Data Processing
Abstract Digital Dashboard with Alphanumeric Codes and Error Strings
Stock Market Data on Holographic Display with Index Fluctuations
Premium
Planning, meeting and man with team on tablet for graph, kpi research or data analysis. Presentation, digital agency and workers on tech with charts, documents or statistics for seo report on screen
Interactive Financial Graphs Displaying Market Trends and Data
Abstract Stock Market Data and Financial Graphs Visualization
Abstract View of Stock Market Graph Overlaying Skyscraper
Dynamic Financial Charts and Data for Market Analysis
Dynamic Financial Data Streams in Motion
Abstract Financial Chart with Statistics on Yellow Background
Colorful Data Visualization with Bar Graphs and Statistics Overlay
Global Stock Market Data and Economic Analysis on World Map
Premium
A close-up of a digital screen displaying various data charts, graphs, and analytics in a modern office environment.
Financial Data and Global Business Interface
Digital Data Collection on Modern Office Building Background
Financial Data Analysis with Error Reports and Graph
Abstract Digital Interface of Stock Price Graph Over City View
Premium
Using tablet pc, Consultant between bookkeepers and accounting lawyer consultation about asset, balance sheet, stock market statistics and yearly tax law, protect business from bribery.
Abstract City Skyline with Data Graph and Code
Financial Data Analysis Overlayed on Modern Cityscape
Numeric Data Flow with Graphs on Digital Interface
Global Financial Data Interface with Dynamic ASM
Financial Data Visualization with Statistics and Graphs
Fluctuating Finance Chart with Company Percentages and Abbreviations
Global Financial Data Processing with Digital Analytics
Data Processing Concept Over Computer Motherboard
Dynamic Financial Statistics Overlay on Cityscape Background
Digital Financial Data Overlay on World Map
Digital Financial Data Processing and Analytics
Rising Financial Graph with Blue Tones Indicating Growth
Digital Financial Data Analysis with Graph Overlay
Digital Data Streams Processing Over Modern Cityscape
Digital Stock Market Overview with Graphs and Numbers for Financial Analysis
Financial Charts Over Cityscape Reflecting Economic Trends
Digital Data Graphs with Cloudy Background for Business Intelligence
Dynamic Digital Data and Technology Interfaces
Abstract Digital Data Processing and Global Networking Concept
Digital Financial Data and Analytics over Urban Cityscape
Premium
Analyze vibrant data trends with a laptop for strategic business decisions and gain insightful analytics for success in today's competitive market
Abstract Financial Data Graph with Digital Overlay
Financial Data Visualization with Bar Charts and Error Information
Stock Market Volatility Reflected in Declining Red Graph
Digital Finance Data Display with Digital Interface
Premium
Business finance data analytics graph.Financial management technology.Advisor using KPI Dashboard on virtual screen.
Analyzing Error Codes with Digital Dashboard Trends
Global Economy and Stock Market Data Concept Visualization
Holographic Financial Graphs Over Blue Background
Abstract Digital Financial Data with Moving Light Trails
Premium
Analyst working with Business Analytics and Data Management System on computer to make report with KPI and metrics connected to database. Corporate strategy for finance, operations, sales, marketing
Digital Financial Data Overlay for Stock Market Analysis
Digital Representation of Global Financial Markets and Data Processing
Analyzing Complex Financial Data in Digital Display
Digital Financial Analytics with Statistics and Data Visualization
Premium
Data science and big data technology. Data scientist computing, analysing and visualizing complex data set on computer. Data mining, artificial intelligence, machine learning, business analytics.
Premium
Business Professional Analyzing Financial Data on a Touchscreen Display in a Dark Environment with Colorful Graphs and Charts
Abstract Financial Data with Bar Graph Overlay
Digital Financial Data Graph with Statistics and Figures
Businessman Analyzing Digital Financial Data with Graphs and Numbers
Explore More Free Stock Images