
- Home >
- Stock Photos >
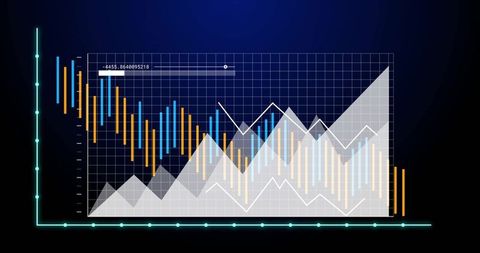
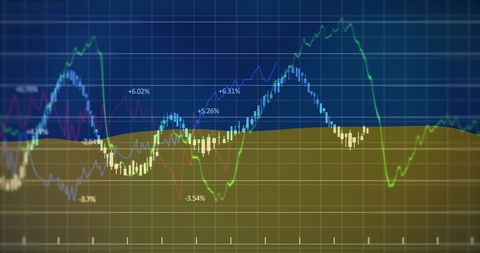
- Dynamic Data Visualization Chart with Neon Grid and Peaks
Dynamic Data Visualization Chart with Neon Grid and Peaks Image

Image shows a multiseries data chart displayed with a modern, neon-lit grid background. The varying heights of bars and smooth peaks convey a blend of detailed analytics and aesthetically appealing design. This can be used in presentations or websites focusing on data analysis, technology, finance, statistics, and digital innovation.
Powered by 


downloads
Tags:
More
Credit Photo
If you would like to credit the Photo, here are some ways you can do so
Text Link
photo Link
<span class="text-link">
<span>
<a target="_blank" href=https://pikwizard.com/photo/dynamic-data-visualization-chart-with-neon-grid-and-peaks/84806c8ab90195305bdbce2da40e8174/>PikWizard</a>
</span>
</span>
<span class="image-link">
<span
style="margin: 0 0 20px 0; display: inline-block; vertical-align: middle; width: 100%;"
>
<a
target="_blank"
href="https://pikwizard.com/photo/dynamic-data-visualization-chart-with-neon-grid-and-peaks/84806c8ab90195305bdbce2da40e8174/"
style="text-decoration: none; font-size: 10px; margin: 0;"
>
<img src="https://pikwizard.com/pw/medium/84806c8ab90195305bdbce2da40e8174.jpg" style="margin: 0; width: 100%;" alt="" />
<p style="font-size: 12px; margin: 0;">PikWizard</p>
</a>
</span>
</span>
Free (free of charge)
Free for personal and commercial use.
Author: People Creations
Similar Free Stock Images

Premium


Premium

Premium


Premium


Premium

AI


Premium


Premium


Premium


Premium


Premium

Premium


Premium


Premium


Premium

Premium

Premium


Premium


AI


Premium


Premium


Premium


Premium


Premium


Premium


Premium


Premium

Explore More Free Stock Images